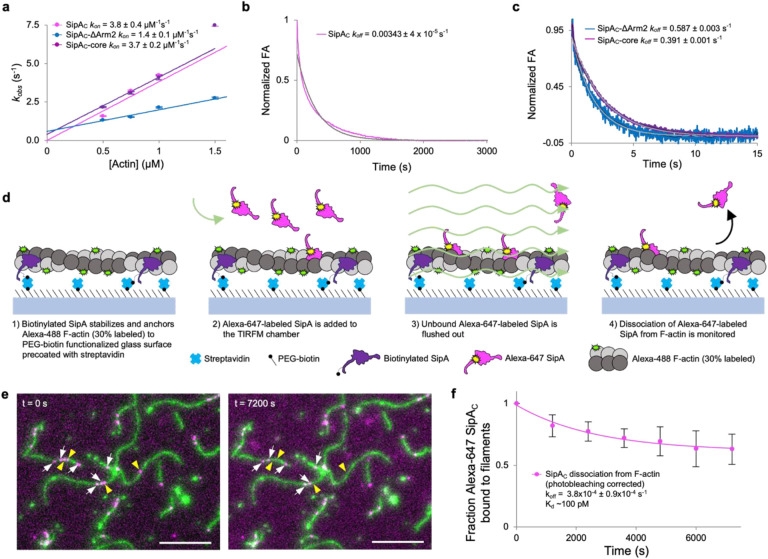
Fig. 4. Association and dissociation rates of SipAC are dictated by the Core and Arm2 domains, respectively.
a, The kobs values determined from kinetic association experiments plotted against actin concentration show a linear relationship and yield kon values for each SipAC construct. (b,c) Dissociation kinetics of FM-SipAC (b), FM-SipAC-ΔArm2 and SipAC-Core (c) from F-actin upon competition with excess of respective unlabeled constructs yields koff values for each construct. Grey traces represent fits to a single exponential. (d) Schematic of TIRFM experiments to monitor dissociation of SipAC from F-actin. (e) Representative images from TIRFM dissociation experiments. White arrows indicate Alexa-647 SipAC molecules present throughout the experiment duration from t = 0 s (left) to t = 7200 s (right); yellow arrowheads indicate Alexa-647 SipAC molecules present at t = 0 s but not at t = 7200 s. (f) Dissociation of Alexa-647 labeled SipAC from Alexa-488 labeled F-actin in TIRFM corrected for photobleaching was fit to a single exponential decay equation providing an estimate of koff, which yields a Kd of ~100 pM.

