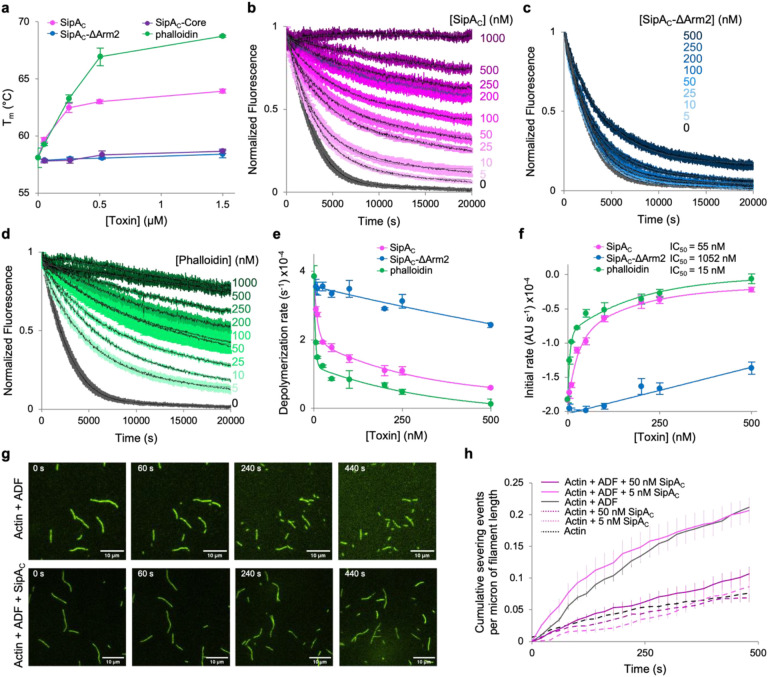
Fig. 6. Arm2 of SipAC mimics the effects of phalloidin on actin stabilization.
a, Effects of bound SipAC constructs or phalloidin on melting temperature (Tm) of F-actin measured by differential scanning fluorimetry. b-d, Inhibition of ADF-stimulated actin depolymerization by various concentrations of SipAC (b), SipAC-ΔArm2 (c), and phalloidin (d). e,f, Data shown in b-d were quantified as single-exponential decay rates (e) or initial depolymerization rates (f) and plotted against toxin concentration. Lines represent double exponential decay fits for SipA and phalloidin, and linear fits for SipAC-ΔArm2. g,h, F-actin severing analysis. g, Representative TIRF microscopy images of F-actin severed in the presence of ADF alone (top panels), or ADF and SipAC (bottom panels). h, Quantification of severing events plotted over time.

