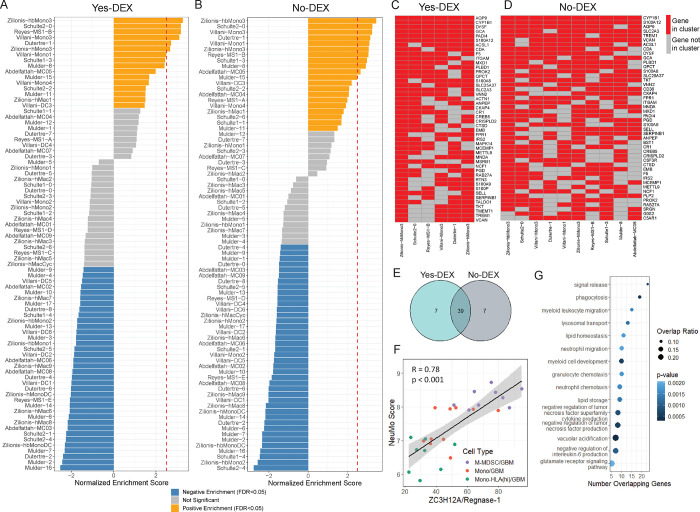
Figure 3: Identification of genes enriched in M-MDSCs and creating a NeuMo expression score that includes overlapping genes in DEX exposed and non-exposed subjects.
A and B. Gene Set Enrichment Analysis (GSEA) results for Yes-DEX (A) and No-DEX (B) samples. The y-axis is the name of the scRNA-seq cluster derived from the literature. The x-axis is the normalized enrichment score (NES). The bar is colored in orange for “Positive Enrichment” (FDR<0.05, NES>0). This indicates a scRNA-seq cluster is overrepresented at the genes up-regulated in M-MDSC compared to Mono. The bar is blue for “Negative Enrichment” (FDR<0.05, NES<0). This indicates a scRNA-seq cluster is overrepresented at the down-regulated genes in M-MDSC compared to Mono (i.e., up-regulated in Mono). The bar is colored in grey if FDR>0.05. The red dashed line is at a NES=2.5. C and D. Heatmaps of the most common leading-edge genes among the 6 scRNA-seq literature-derived clusters from the Yes-DEX GSEA (C) and the 10 scRNA-seq literature-derived clusters from the No-DEX GSEA (D), genes on the y-axes and scRNA-seq clusters on the x-axes. These 6 and 10 gene sets were chosen due to their high NES (>2.5) and low FDR (<0.05). Red boxes denote genes found to be in the leading-edge for that cluster from the GSEA, and grey if not. E. A Venn diagram of the overlap between Yes-DEX, No-DEX leading-edge genes. F. Scatter plot of NeuMo score versus ZC3H12A expression in M-MDSC, Mono, and Mono-HLA (hi) from GBM samples, where “R” is the Pearson correlation coefficient, and the black line is the best fit line. G. Dot plot showing the results of a pathway enrichment analysis using Gene Ontology (GO) Biological Processes terms for the NeuMo (39) and NeuMo-correlated genes (531). The y-axis contains the name of the GO term and the x-axis, the number of input genes NeuMo and NeuMo-correlated genes that overlap with the GO term. The size of the dot reflects the magnitude of the overlap (i.e., Number of Overlapping Genes/Total Number of Genes in Pathway), while the color represents significance from the over-representation test.

