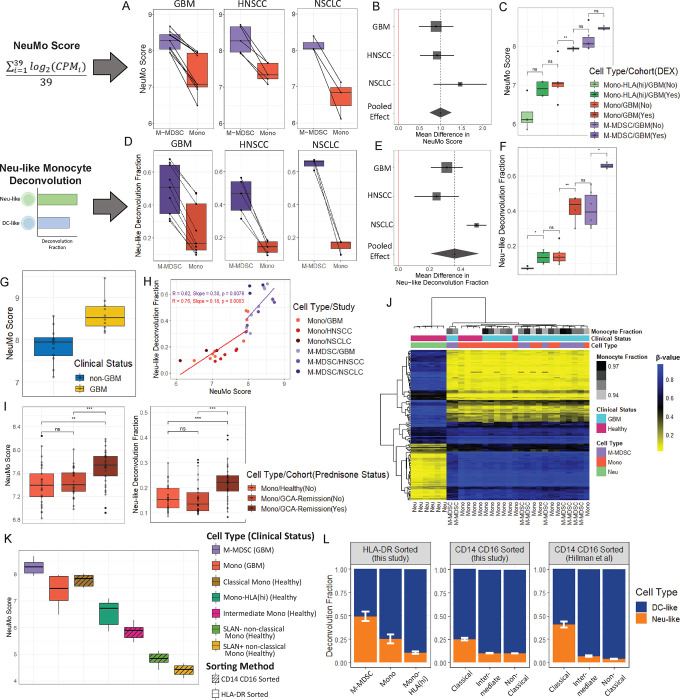
Figure 4: Assessment of the NeuMo score and Neu-like monocyte deconvolution fraction in bulk RNA-seq cancer and glucocorticoid exposure datasets.
A and D. NeuMo score (A) and Neu-like deconvolution fraction (D) in paired M-MDSC (purple) and monocytes (red) from GBM, HNSCC and NSCLC. B and E. Meta-analysis of NeuMo score (B) and Neu-like fraction (E). The points represent the mean difference between M-MDSC and monocytes, with the stippled lines (or diamond width) representing the 95% CI and the box size representing the sample size. C and F. NeuMo scores (C) and Neu-like fractions (F) split by DEX status in monocytes, HLA-DR high monocytes and M-MDSC. G. NeuMo score in whole blood from GBM (N=10) and non-GBM (N=12) individuals. H. Scatter plot of NeuMo score and Neu-like fraction. “R” depicts Pearson’s correlation coefficient. I. NeuMo score and Neu-like fractions in monocytes from prednisone treated giant cell arteritis (GCA) subjects, untreated GCA subjects, and controls57. J. Heatmap of monocyte and neutrophil lineage-discriminating CpG probes for M-MDSC from GBM (N=9), Mono from GBM (N=10) and healthy donors (N=5) and neutrophils (Neu) from healthy individuals (N=6). The colors within the heatmap represent the beta-value ranging from 0 (yellow) to 1 (blue). The monocyte fraction is estimated from CIBERSORTx using expression data. A monocyte fraction was not estimated for healthy Mono or Neu (colored in white). K. NeuMo score in M-MDSC (N=9), Mono (N=10), Mono-HLA (hi) (N=8) from GBM patients and Classical Mono (N=8), Intermediate Mono (N=8), SLAN− non-classical Mono (N=8) and SLAN+ non-classical Mono (N=8) from healthy individuals. Striped boxplots indicate sorting based on CD14 CD16 and no stripes indicate sorting based on HLA-DR. L. Average deconvolution fraction of Neu-like (orange) and DC-like (blue) cell states on bulk RNA-sequenced M-MDSC, Mono, Mono-HLA(hi) from GBM patients (this study), classical, intermediate, non-classical monocytes (SLAN− and SLAN+ were grouped together) from healthy individuals (this study), and classical, intermediate, and non-classical monocytes in another healthy individual cohort59. Error bars represent the standard error of the mean of the Neu-like fraction. P-values in boxplots in C and F are based on Wilcoxon rank-sum test and in I on two-sample t-test: ns=p>0.05, *=p<0.05, **=p<0.01, ***=p<0.001

