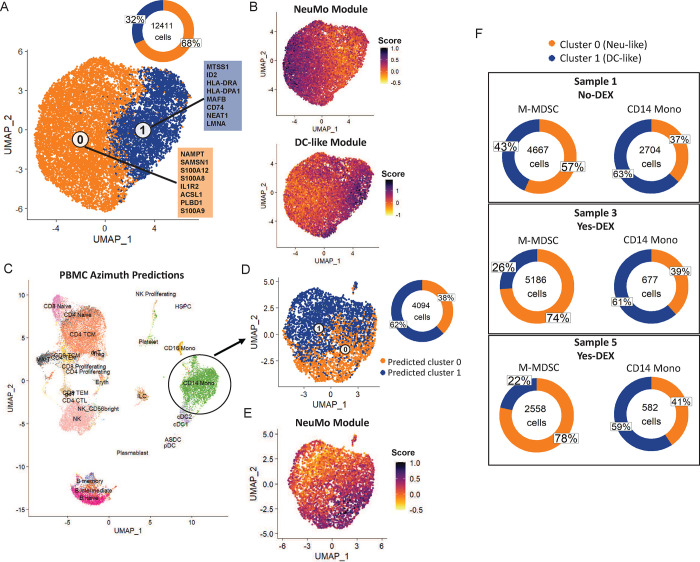
Figure 6: GBM scRNA-seq clusters at 2-compartment resolution and their prevalence in M-MDSC and classical, intermediate and non-classical monocytes.
A. Integrated and clustered M-MDSC samples (N=3). The orange (cluster 0, Neu-like state) and blue (cluster 1, DC-like state) boxes represent each cluster’s top 8 marker genes by log2FC. Donut plot indicates the proportion of cells in each of the two clusters. B. NeuMo and DC-like module scores for the M-MDSC integrated data. A darker purple indicates a higher score (i.e., increased expression of NeuMo-associated or DC-associated genes) and a yellow color indicates a lower score. C. Integrated and clustered PBMC samples from healthy donors (N=4) with cells colored in by Azimuth cell type predictions. D. Integrated and clustered predicted CD14+ monocytes from PBMC. A cell’s cluster classification was predicted using the M-MDSC clusters in (A) as the reference. E. NeuMo module score for the CD14+ monocytes. A darker purple color indicates a higher score. F. Donut plots comparing proportion of Neu-like and DC-like cells between M-MDSC and CD14+ monocyte samples from the same individual. The proportions are calculated by splitting the integrated M-MDSC data (A) and integrated CD14+ monocyte data (D) by individual.

