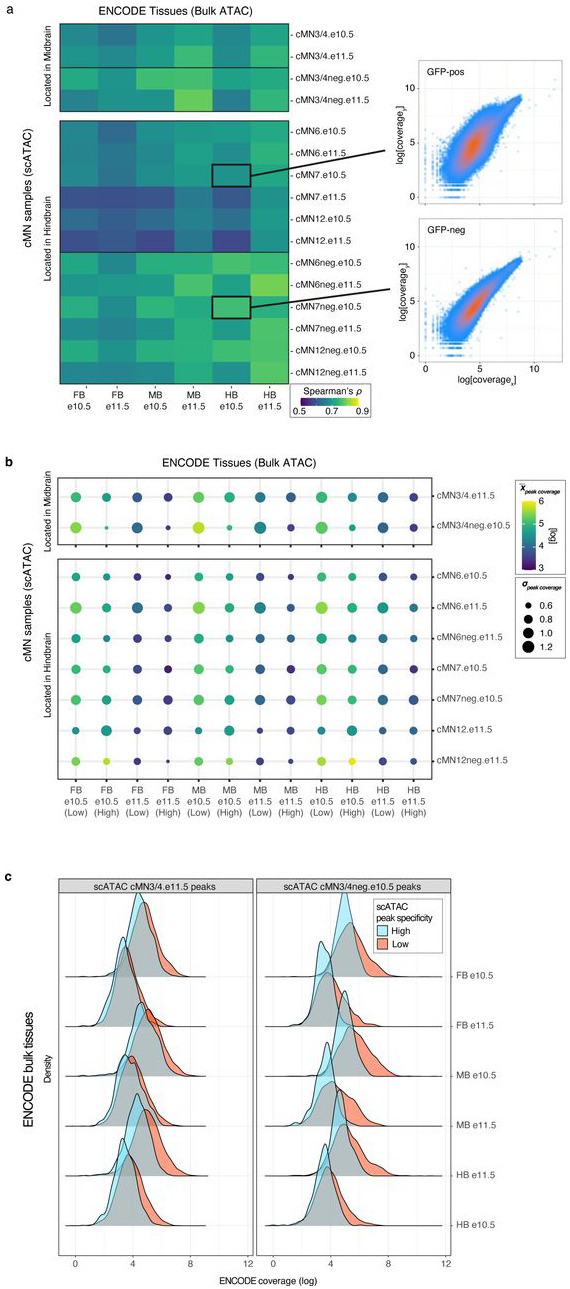
Extended Data Figure 3. Cranial motor neuron scATAC peaks are underrepresented in regional bulk datasets.

a. (Left) Heatmap depicting correlation coefficients (Spearman’s ) between scATAC peaks from cMN microdissections versus bulk ATAC peaks from ENCODE e10.5 and e11.5 mouse developing forebrain (FB), midbrain (MB), and hindbrain (HB) dissections. Anatomically concordant bulk brain regions are more highly correlated with scATAC non-motor neuron samples (‘−neg’) than scATAC cranial motor neuron samples. (Right) Scatterplots depicting rank-ordered per-peak sequencing coverage for bulk vs. scATAC samples.
b. Bubble chart depicting ENCODE bulk ATAC coverage in scATAC cMN peaks from a subset of samples, stratified by cell type specificity scores (‘High’ vs. ‘Low’). Colors reflect mean peak coverage (with lighter color reflecting higher coverage), while area reflects standard deviation. Bulk tissues tend to have higher coverage in low specificity peaks when compared to highly cell type specific peaks.
c. Density plots depicting distribution of ENCODE bulk peak coverage within cMN3/4 scATAC peaks from (b), stratified by specificity scores. High specificity scATAC peaks (blue) have consistently lower bulk coverage compared to low specificity peaks (red).
