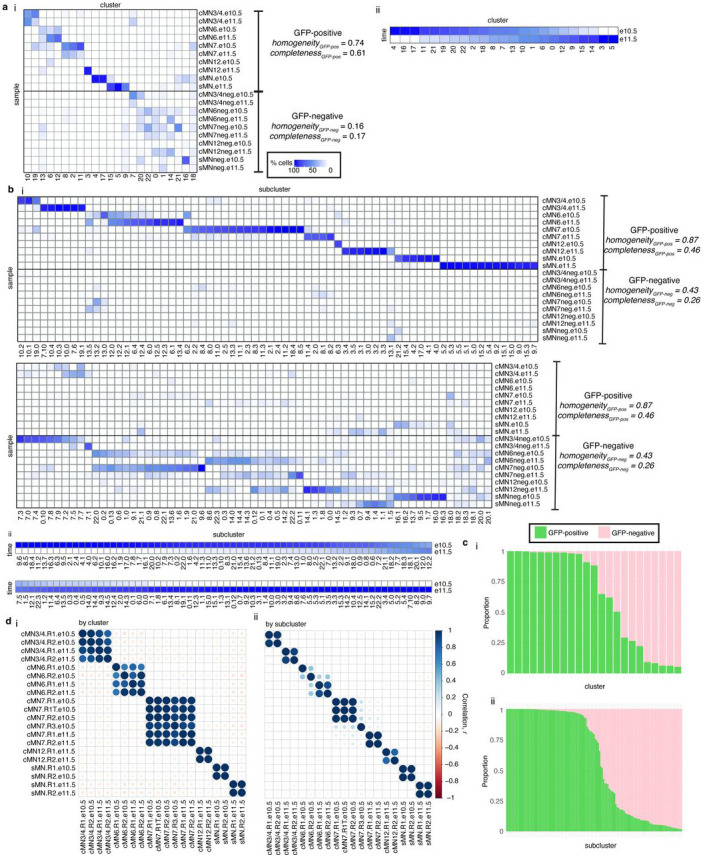
Extended Data Figure 4. scATAC cluster purity across major clusters and subclusters.

a. Heatmaps depicting purity of the 23 major scATAC clusters, stratified by i) sample and ii) embryonic age. cMN7 cells migrate past cMN6, are in close spatial proximity at these developmental ages, and are commonly co-dissected. Samples are GFP-positive unless otherwise marked (‘neg’). Clusters with higher membership from GFP-positive samples have higher purity than clusters with higher membership from GFP-negative samples. Most clusters feature cells from both e10.5 and e11.5 dissections, consistent with ongoing cell birth and proliferation. Homogeneity/completeness metrics calculated for GFP-positive versus GFP-negative samples are shown.
b. Heatmaps depicting purity of the 132 scATAC subclusters, stratified by i) sample and ii) embryonic age. As observed with the major clusters in (a), subclusters with high GFP-positive membership have greater purity than high GFP-negative subclusters. In contrast to the major clusters, a greater proportion of subclusters have skewed temporal membership (e10.5 vs. e11.5), potentially reflecting transient cell states.
c. Stacked barplots depicting proportion of GFP-positive and -negative cells within each i) cluster and ii) subcluster. Most clusters and subclusters are skewed towards pure (i.e., > 90%) GFP-positive or −negative membership. Here Cluster/subcluster IDs are not shown for ease of visualization. Detailed cluster annotations are available in Supplementary Table 3.
d. Correlation matrix depicting pairwise correlations between all biological replicates among i) major clusters and ii) subclusters. Cluster/subcluster membership is highly correlated across biological replicates from different batches, particularly for subclusters.
