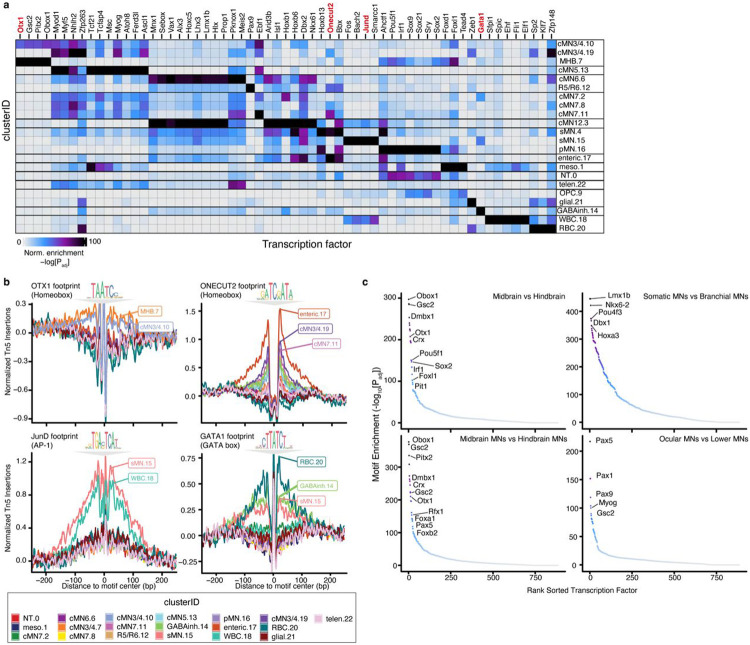
Figure 2. Motif enrichment and aggregate footprint analyses distinguish cell type specific TF binding motifs.
a. Heatmap depicting enriched transcription factor binding motifs within differentially accessible peaks by cluster. Each entry is defined by its cluster identity (“clusterID.clusterNumber”). Corresponding cluster IDs and annotations are depicted. Color scale represents hypergeometric test p-values for each cluster and motif. Specific motifs and motif families vary significantly amongst clusters. Cluster annotations are defined in Supplementary Table 3.
b. Aggregated subtraction-normalized footprinting profiles for a subset of cluster-enriched transcription factors (OTX1, ONECUT2, JunD, and GATA1) from (a), centered on their respective binding motifs. Specific clusters display positive evidence for TF motif binding for each motif. Corresponding motif position weight matrices from the CIS-BP database are depicted above each profile. Cluster IDs with corresponding color are below.
c. Motif enrichment comparing broad classes of neuronal subtypes. Midbrain subtype contains motifs from cMN3/4neg cells; hindbrain from cMN6neg, cMN7neg, and cMN12neg cells; somatic MN from cMN3/4, cMN6, and cMN12 GFP-positive cells; branchial MN are from cMN7 GFP-positive cells; midbrain MN are cMN3/4 GFP-positive cells; hindbrain MN are cMN6, cMN7, and cMN12 GFP-positive cells; ocular MN are cMN3/4 and cMN6 GFP-positive cells; lower MN are cMN7, cMN12, and sMN GFP-positive cells. For each graph, the first listed subtype is enriched relative to the second listed subtype.

