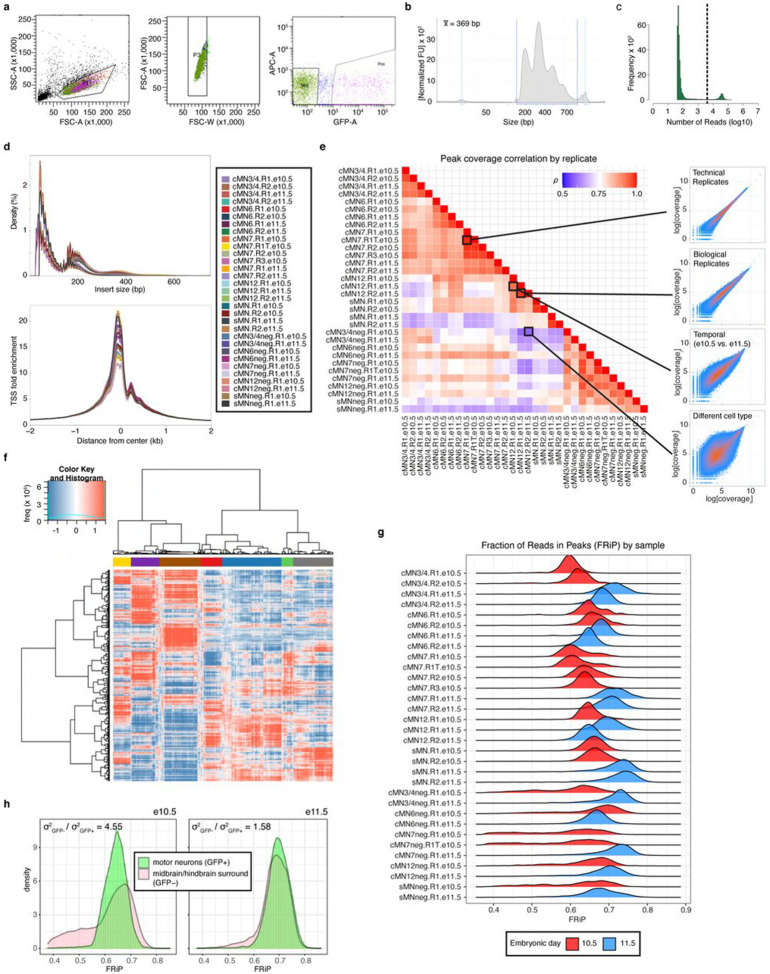
Extended Data Figure 1. Per-cell and -sample quality metrics for scATAC data.
a. Representative FACS gating strategy for WT GFP-positive and GFP-negative cMN7 at e10.5. Left: Forward scatter area (FSC-A) and side scatter area (SSC-A), corresponding to cell size and granularity/complexity, are used to enrich for intact cells and exclude debris. Middle: forward scatter width (FSC-W) and FSC-A are used to exclude doublets. Right: Green fluorescent protein area (GFP-A) and 633 nm-excitation (APC-A) are used to enrich for GFP-positive and GFP-negative cells. GFP-negative gates are calibrated by dissociated limb buds prior to collection as a negative control. All samples are fresh, live cells without fixative or nuclear staining.
b. Representative TapeStation trace showing tagmented DNA fragment sizes prior to library preparation.
c. Representative histogram of per-cell scATAC reads in a single sample. Read cutoff is shown by a dotted line and determined heuristically for each sample.
d. Insert size distributions (top) and transcriptional start site (TSS) enrichment (bottom) for all samples and replicates. Insert sizes consistently show a characteristic nucleosome banding pattern (~147 bp wavelength). Samples IDs are shown in Supplementary Table 2.
e. Correlation matrix depicting all possible pairwise sample correlations (Spearman’s rho) for scATAC coverage in all rank-ordered peaks. Scatterplots for selected sample pairs from the four highlighted boxes within the matrix are shown on the right. Correlations decrease with increasing biological distance (top to bottom).
f. Representative clade diagram depicting the relative accessibility (red is positive, blue is negative) of 5kb genomic windows (rows) across individual cells within a given sample (columns). Distinct clades (colored bars) were determined heuristically for each sample for downstream peak calling. The number of clades per sample were selected to maximize representation of common and rare cell types.
g. Ridgeplot depicting density of per-cell fraction of reads in peaks (FRiP) for each dissected sample and replicate at e10.5 (red) and e11.5 (blue). Samples IDs are shown in Supplementary Table 2. Mean FRiP values are consistently higher for e11.5 samples (p-value = 4 x 10⁻⁵, binomial test).
h. Distribution of FRiP values for GFP-positive motor neurons (green) versus GFP-negative surrounding brain tissue (pink). GFP-negative cells display significantly greater dispersion compared to GFP-positive cells, particularly at e10.5. (p-value = 1.1x10−286, Brown-Forsythe Test). See Supplementary Note 1 for additional information.

