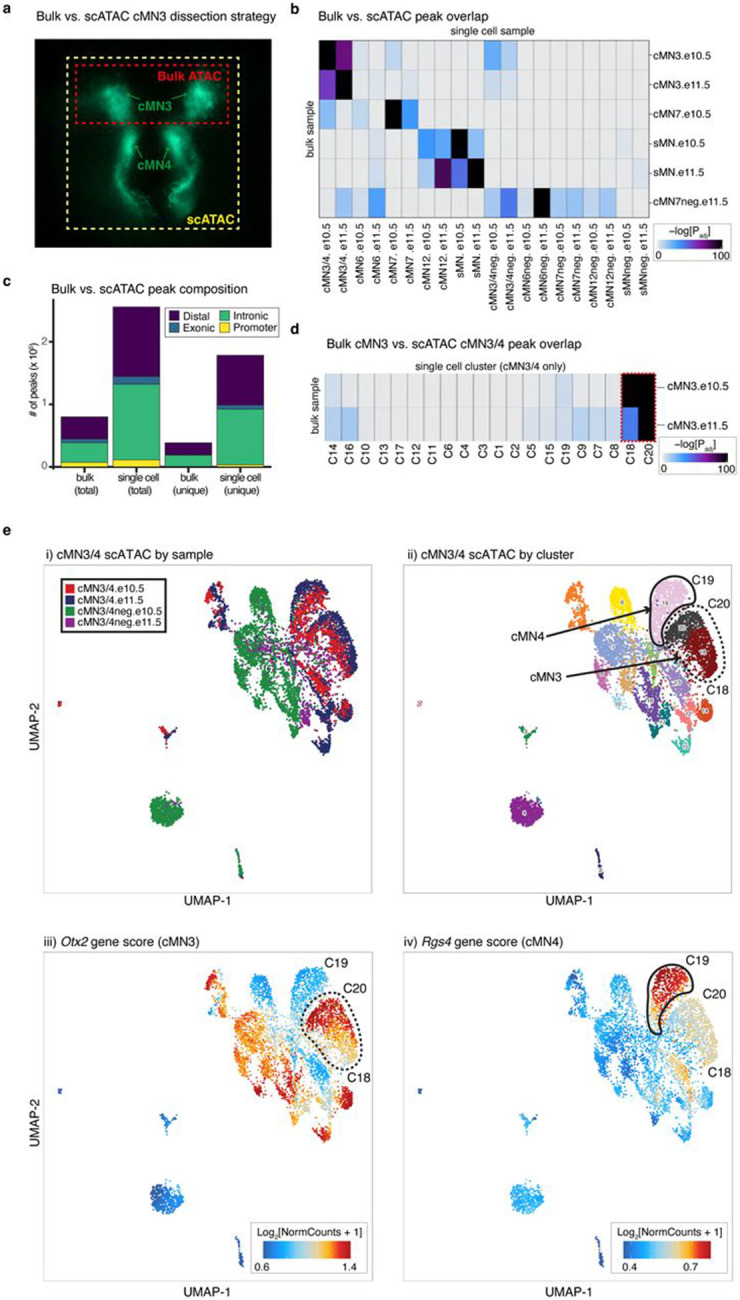
Extended Data Figure 2. Comparing and contrasting bulk versus single cell ATAC profiles.

a. Fluorescence microscopy image illustrating cMN3 and cMN4 microdissection strategies. For scATAC experiments, cMN3 and cMN4 were microdissected en bloc (yellow box). For bulk ATAC microdissections, only cMN3 was excised (red box). All other cMN microdissection strategies were identical across bulk and scATAC.
b. Heatmap depicting enrichment of sample-specific bulk ATAC versus scATAC peaks. Color scale represents hypergeometric test p-values using the peakAnnoEnrichment() function in ArchR. Samples marked with “neg” are GFP-negative cells surrounding the motor neurons of interest. All other samples are GFP-positive motor neurons.
c. Stacked barplot depicting relative proportions of different classes of accessible chromatin (“distal”, “exonic”, “intronic”, and “promoter”). scATAC peaks are enriched for total number of peaks, total number of unique peaks, and cell type-specific peak annotations (distal and intronic).
d. Heatmap depicting enrichment of overlapping peaks for bulk cMN3 dissections versus ad hoc clusters (C1-C20) generated from scATAC cMN3/4 dissections only. Color scale represents hypergeometric test p-values. Ad hoc clusters C18 and C20 with the highest peak enrichment for bulk cMN3 are outlined by dashed red lines.
e. In silico microdissection of scATAC cMN3/4 clusters corroborates physical microdissections. Left to right, UMAP embeddings of scATAC cMN3/4 dissections colored by i) dissected sample; ii) ad hoc clusters; and gene scores for iii) cMN3 marker gene Otx2126; and iv) cMN4 marker gene Rgs4127. Putative cMN3 (C18 and C20) and cMN4 (C19) clusters inferred from dissection origin, marker genes, and GFP status are denoted by dashed and solid red lines, respectively.
