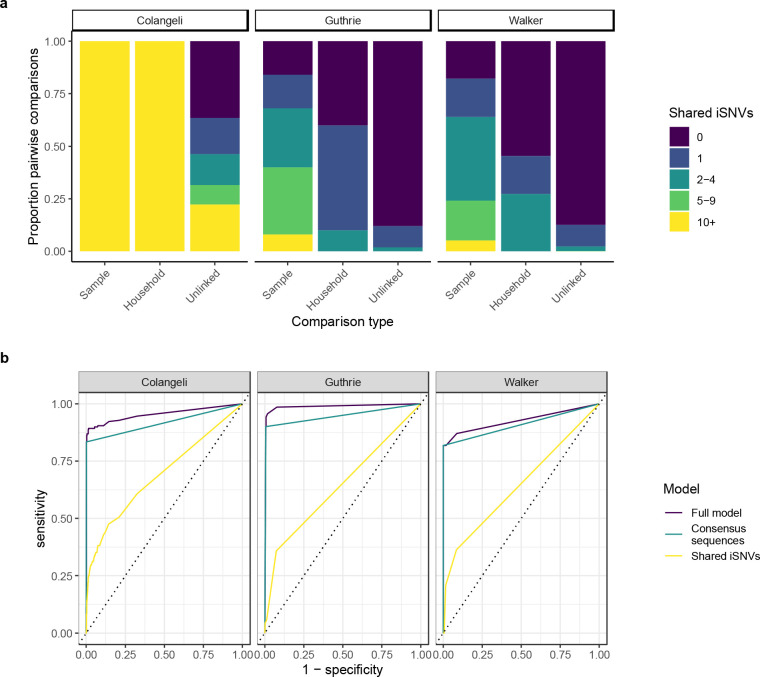
Figure 4. Shared minority variants contain information about household membership.
(a) Stacked barplot showing the proportion of sample pairs across different levels of shared minority variants ≥ 1% minor allele frequency threshold. Panels indicate study. (b) ROC curves showing sensitivity (true positive rate) as a function 1 – specificity (true negative rate) for predicting household membership in general linear models that include both shared iSNVs and consensus sequence-based clusters (Full model), consensus sequence-based cluster only (Consensus sequences), and Shared iSNVs only (Shared iSNVs). All models include study as a predictor.

