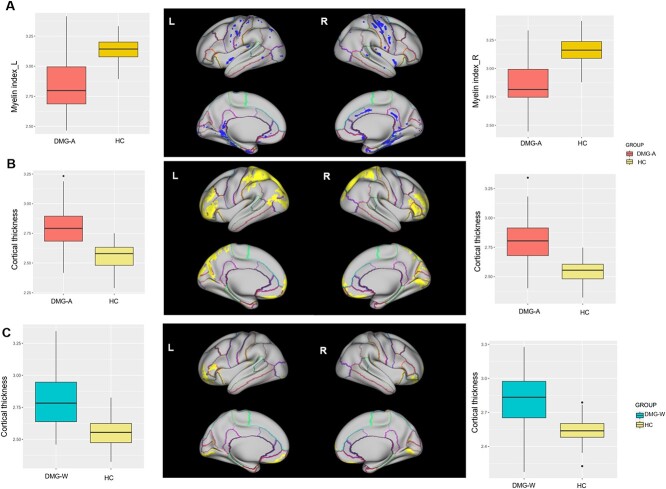
Fig. 2.
Cortial myelin and thickness differences between patients’ group and HC. The upper panel (A) exhibits reduced myelin content, while the lower panel (B) displays increased cortical thickness in the comparison between the DMG-A group and HC. The boxplots on both sides showed the distribution of myelin index and cortical thickness in significant clusters of left and right hemisphere, respectively. In panel (C), regions (in yellow) exhibiting increased thickness in the comparison between the DMG-W group and HC. Similarly, boxplots on both sides showed the distribution of thickness index in significant clusters of left and right hemisphere, respectively. Abbreviations: DMG-A, diffuse midline glioma with H3 K27-altered; DMG-W, diffuse midline glioma with H3 K27 wild-type; HC, healthy controls.

