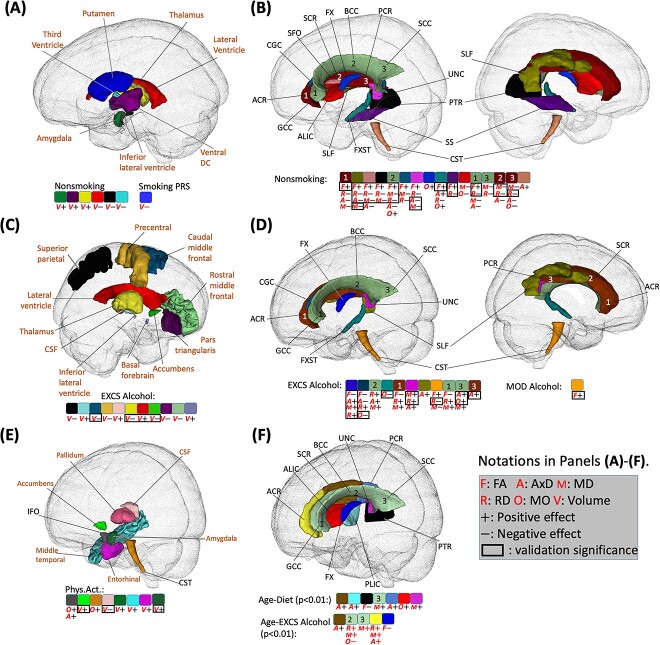
Fig. 4.
Identified brain regions with the effects of lifestyle factors. (A) Regions with effects of non-smoking phenotype and smoking PRS score on volume (shown with “V”; directions of effects are denoted by “+” for positive and “−” for negative). (B) Regions with effects of non-smoking phenotype on WM diffusivity (shown with “F,” “A,” “M,” “R,” and “O” for FA, AxD, MD, RD, and MO, respectively). (C) Regions with effects of excessive alcohol (EXCS alcohol) on volume. (D) Regions with effects of excessive alcohol (EXCS alcohol) on diffusivity. (E) Regions with effects of physical activity (Phys.Act.) on volume and diffusivity. (F) Regions with effects of age-diet and age-EXCS alcohol interactions on diffusivity. In (A)-(E), only signals with P < 2.37E-4 in the British population that are validated by non-British ancestry populations (showing the same direction) are displayed. In (F), signals with P-values < 0.01 in the British population that are validated by non-British ancestry populations are displayed. Signals with P < 0.05 for non-British ancestry populations are enclosed with a black rectangle. PRS, polygenic risk score; FA, fractional anisotropy; AxD, axial diffusivity; MD, mean diffusivity; RD, radial diffusivity; MO, mode of diffusivity. Note that 0.01 and 0.05 are not Bonferroni corrected and 2.37E-4 is the Bonferroni corrected significance level.

