. 2023 Dec 19;15(3):1150–1158. doi: 10.1039/d3sc06357g

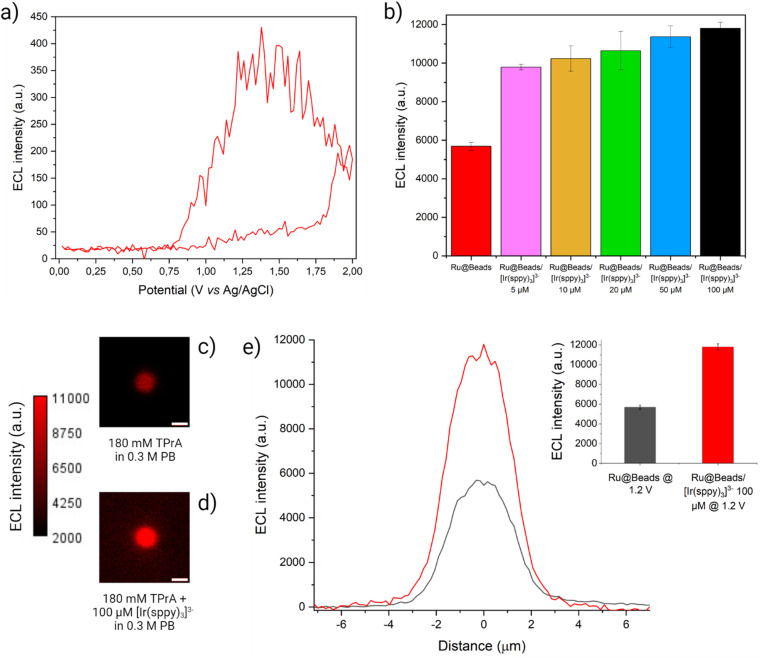
Fig. 3. (a) CV-ECL measurement performed on Ru@Beads/[Ir(sppy)3]3− in a 0.3 M PB solution at pH 6.8 with 180 mM TPrA and 100 μM [Ir(sppy)3]3−. The working electrode potential was scanned at 100 mV s−1 from OCP up to 2 V (vs. Ag/AgCl), back to 0 V (vs. Ag/AgCl) and, eventually, terminating the cycle at OCP. The beads ECL emission (red line) was acquired each 200 ms and, for each frame, the maximum value of the beads ECL profile is plotted versus the applied potential. The background signal is eliminated by subtracting, for each frame, the average ECL intensity value of the background retrieved over a 50 × 50 pixel square centred in a region of the image where no beads are present. (b) Comparison between ECL intensities of Ru@Beads (red bar) and of Ru@Beads/[Ir(sppy)3]3− in a 0.3 M PB solution at pH 6.8 with 180 mM TPrA and different [Ir(sppy)3]3− concentrations: 5 μM (pink bar), 10 μM (yellow bar), 20 μM (green bar), 50 μM (blue bar) and 100 μM (black bar). The ECL intensities were obtained from ECL images captured using an EM-CCD camera during a two-step chronoamperometry measurement: 2 s at OCP and 8 s at 1.2 V vs. Ag/AgCl. Magnification, 100×; objective numerical aperture, 0.8; gain, 1; sensitivity, 255. Data are averaged over a minimum of six beads (n ≥ 6). Each bar represents the maximum value of the respective ECL profile, and the error bars show the standard errors. (c and d) ECL images of a single 2.8 μm bead covalently labelled with [Ru(bpy)3]2+ in a 0.3 M PB solution at pH 6.8 with 180 mM TPrA (c) without (Ru@Beads) and (d) with 100 μM [Ir(sppy)3]3− (Ru@Beads/[Ir(sppy)3]3−). The background signal in (d) is generated by [Ir(sppy)3]3−* following the conventional homogeneous ECL pathways. The images were obtained with an EM-CCD camera by recording the ECL signal for 10 s during a two-step chronoamperometry measurement: 2 s at open circuit potential (OCP) and 8 s at 1.2 V vs. Ag/AgCl. Magnification, 100×; objective numerical aperture, 0.8; gain, 1; sensitivity, 255; contrast intensity scale: 2000 to 11 000; scale bar: 3 μm. (e) Comparison between the single-bead ECL intensity profiles of Ru@Beads (grey line) and Ru@Beads/[Ir(sppy)3]3− (red line). Inset: histogram of the comparison between the respective averaged maximum values of ECL intensity where the error bars show the standard error. Data are averaged over a minimum of six beads (n ≥ 6).

Fig. 3