. 2023 Dec 19;15(3):1150–1158. doi: 10.1039/d3sc06357g

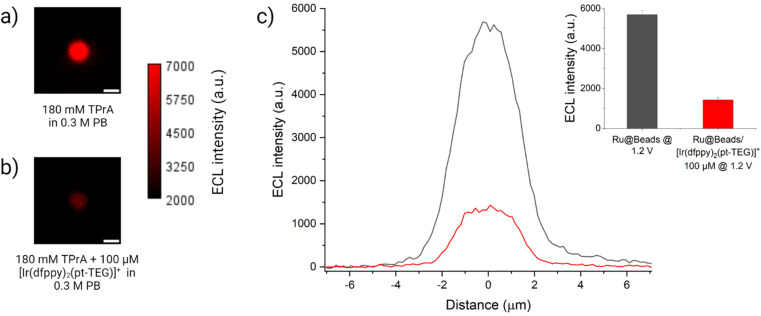
Fig. 4. ECL images of a 2.8 μm single-bead covalently labelled with [Ru(bpy)3]2+ in a 0.3 M PB with 180 mM TPrA (Ru@Beads) (a) without and (b) with 100 μM of [Ir(dfppy)2(pt-TEG)]+. The background signal in (b) is generated by [Ir(dfppy)2(pt-TEG)]+* following the conventional homogeneous ECL pathways. The images were obtained with an EM-CCD camera by recording the ECL signal for 10 s during a two-step chronoamperometry measurement: 2 s at open circuit potential (OCP) and 8 s at 1.2 V vs. Ag/AgCl. Magnification, 100×; objective numerical aperture, 0.8; gain, 1; sensitivity, 255; contrast scale: 2000–7000. Scale bar: 3 μm. (c) Comparison between the single-bead ECL intensity profiles of Ru@Beads (grey line) and Ru@Beads/[Ir(dfppy)2(pt-TEG)]+ (red line). Inset: histogram of the comparison between the respective averaged maximum values of ECL intensity where the error bars show the standard error. Data are averaged over a minimum of six beads (n ≥ 6).

Fig. 4