. 2023 Dec 19;15(3):1150–1158. doi: 10.1039/d3sc06357g

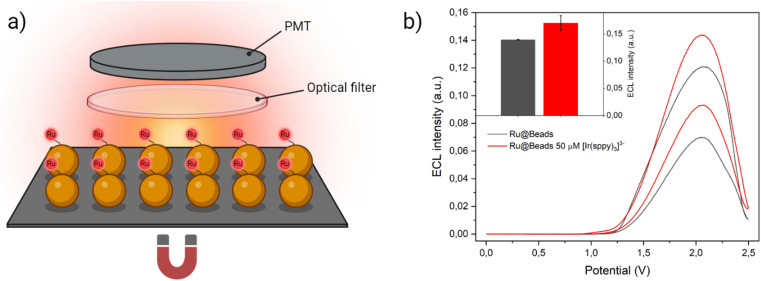
Fig. 5. (a) Experimental setup employed to record the ECL signal in collective beads configuration. The beads were deposited on the surface of a Pt working electrode where they remain because of a magnet placed underneath. To discern the emission of [Ru(bpy)3]2+ labels from the homogeneous ECL of [Ir(sppy)3]3−, the ECL generated during the anodic potential sweep first passed through an optical filter that cuts off the all the light below 606 nm and, eventually, strikes the PMT that capture all the light without spatially resolving the signal. Yet, a small but non-negligible background signal due to [Ir(sppy)3]3− homogeneous ECL could still be detected, thus the ECL intensity generated by Beads/[Ir(sppy)3]3− (i.e., ECL signal of the same amount of non-labelled streptavidin-coated beads in the co-reactant solution with 50 μM of [Ir(sppy)3]3−) was subtracted to Ru@Beads/[Ir(sppy)3]3− during data processing. (b) CV-ECL measurement performed on Ru@Beads (grey line) and of Ru@Beads/[Ir(sppy)3]3− at 50 μM concentration of [Ir(sppy)3]3− (red line), both in a 0.3 M PB solution at pH 6.8 with 180 mM TPrA. The working electrode potential was scanned at 100 mV s−1 from OCP up to 2.5 V (vs. Ag/AgCl), back to 0 V (vs. Ag/AgCl) and, eventually, terminating the cycle at OCP. The inset represents a comparison between ECL intensities of Ru@Beads (grey bar) and of Ru@Beads/[Ir(sppy)3]3− at 50 μM concentration of [Ir(sppy)3]3− (red bar) in a 0.3 M PB solution at pH 6.8 with 180 mM TPrA. Each bar represents the ECL intensity obtained by integrating the whole CV-ECL cycle and the error bars show the standard errors. Data are averaged over two different measurements.

Fig. 5