. 2023 Dec 18;15(3):1106–1116. doi: 10.1039/d3sc05790a

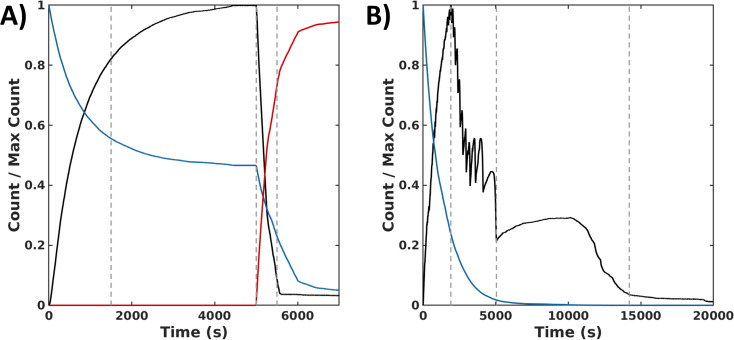
Fig. 6. Simulation data for the sequential and the synchronous processes. (A) Normalized time series of species count for the forward (0 s ≤ t ≤ 5000 s) and backward (t > 5000 s) processes reported in Δt = 0.1 s time intervals: CSSC in fibers (black), H2O2 (blue), and DTTcyc (red). 1st dashed line indicates >75% completion of the forward reaction. 2nd dashed line indicates the addition of DTT which is then converted to DTTcyc. 3rd dashed line represents >75% completion of the backward reaction. (B) Normalized count of assembled subunits CSSCfib (black) and oxidant H2O2 (blue) in time reported in Δt = 0.1 s time intervals. 1st dashed vertical line indicates time of peak amount of CSSC incorporated into fibers. 2nd dashed line marks the end of the oscillatory stage. 3rd dashed line marks the near depletion of CSSC fibers.

Fig. 6