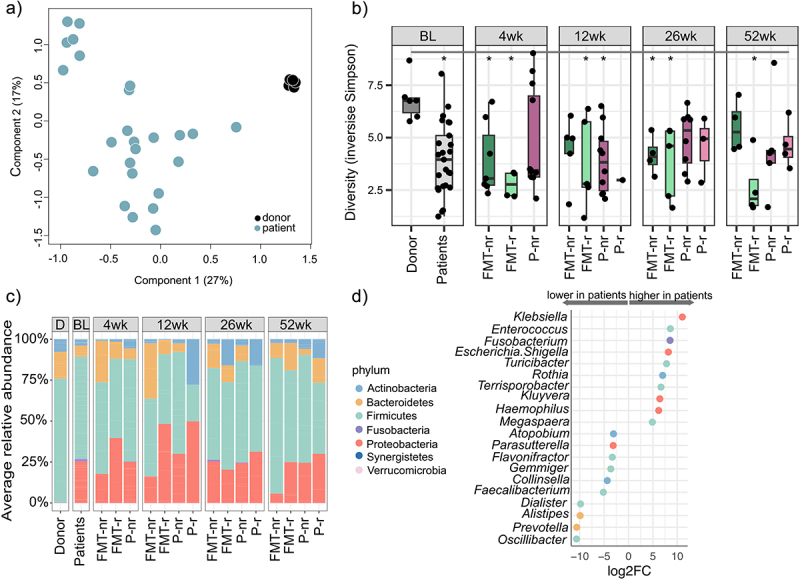
Figure 1.

Luminal microbiota characteristics in chronic pouchitis patients, and comparison to the healthy fecal donor.
a: Genus-level Principal Coordinates Analysis (PCoA) plot at baseline showing separation of patients and the donor. b: Diversity index (inverse Simpson) in the donor samples and patients at baseline and follow-up time points. nr = non-relapsed, r = relapsed. Statistically significant difference indicated with an asterisk (p < .05). c: Phylum-level mean relative abundance in the donor and patients at baseline (BL) and follow-up time points (4 wk, 12 wk, 26 wk and 52 wk) based on study group and relapse status. nr = non-relapsed, r = relapsed. d: Genera with a statistically significant (q < 0.05) difference in relative abundance at baseline between pouchitis patients and the healthy donor. Selected 20 genera with the highest and lowest log2 fold change. Color of the points indicates the phylum.
