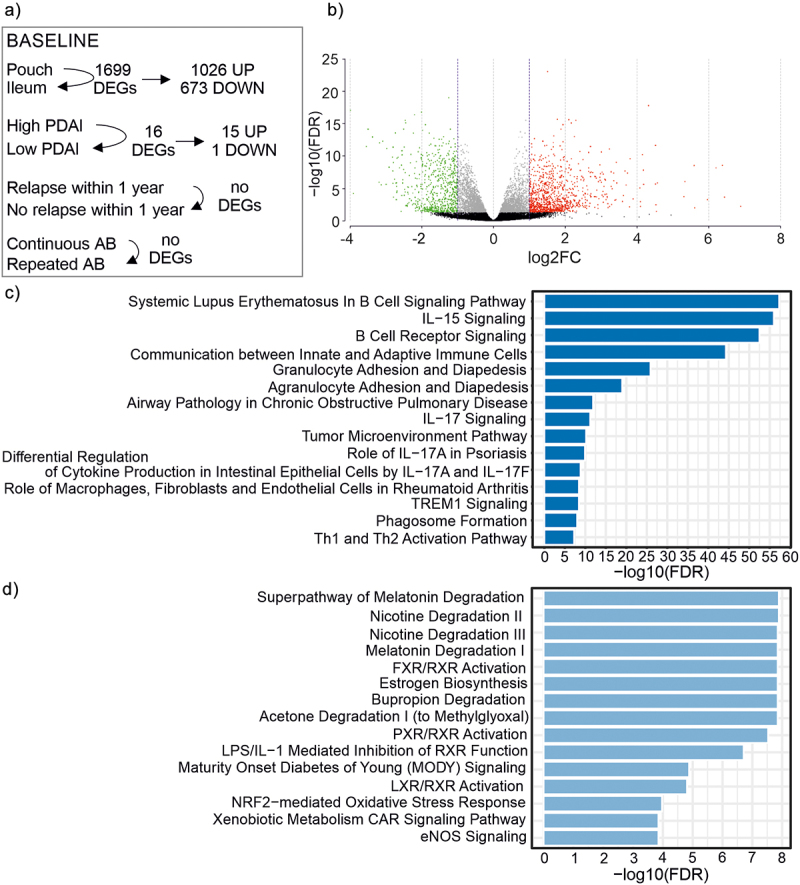
Figure 6.

Baseline characteristics of mucosal gene expression.
a: Schematic representation of the differential gene expression analysis comparisons at baseline and the number of differentially expressed genes (DEGs). Comparison of pouch (n = 26) and ileum (n = 26), patients with high PDAI (≥7, n = 8) versus low PDAI values (<7, n = 18), patients who would eventually relapse (n = 17), independent of treatment group, and who would not relapse (n = 9), and patients who used continuous antibiotics (AB) before the trial (n = 12) and who used repeated antibiotics before the trial (n = 14). b: Volcano plot showing genes from the comparison of ileal and pouch mucosal gene expression with q-value >0.05 in black, q-value <0.05 in gray (q-value <0.05, log2FC < -1.0), in green and (q-value <0.05, log2FC >1.0) in red. c: The 15 most significant canonical pathways associated with upregulated genes in the pouch as compared to the ileum at baseline. d: The 15 most significant canonical pathways associated with downregulated genes in the pouch as compared to the ileum at baseline.
