
Figure 3.
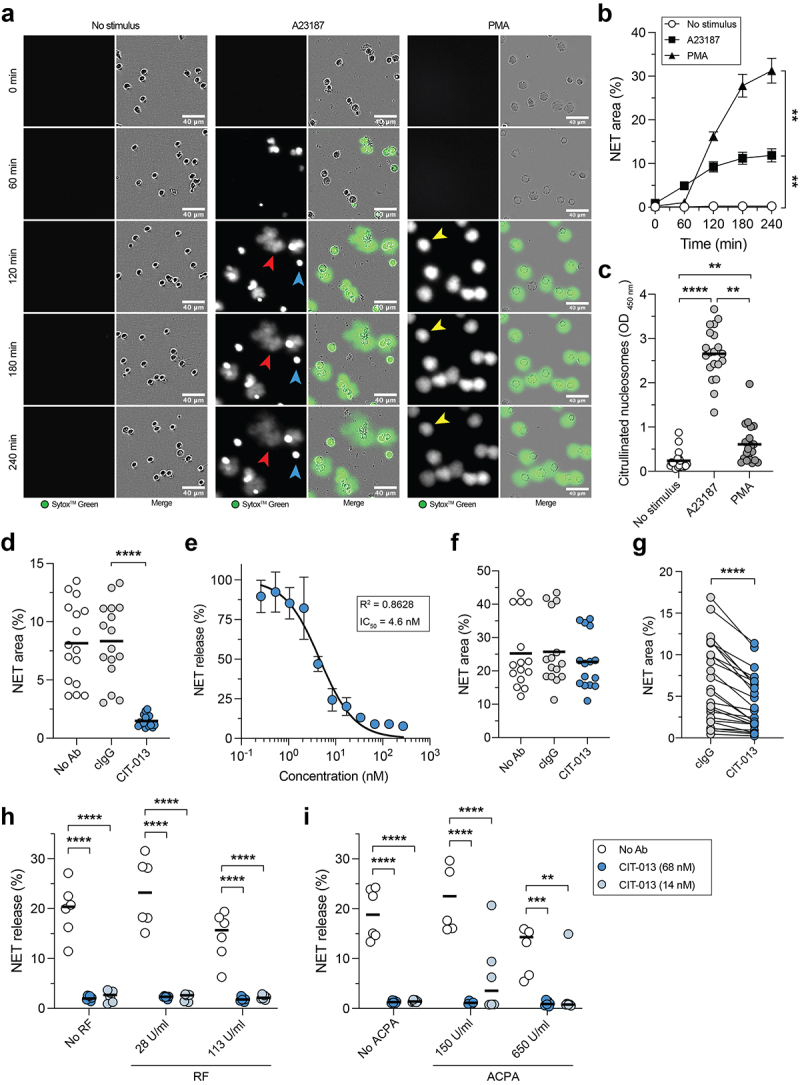
CIT-013 specifically inhibits the release of citrullination rich NETs.
A23187- and PMA-induced NET release was measured by a quantitative immunofluorescence live imaging NET assay using the impermeable DNA dye SytoxTM Green. (a) Representative images of NET release in response to A23187 (red arrows) and PMA (yellow arrows) at different time points. Permeable neutrophils with intracellular chromatin are indicated with blue arrows. (b) Quantification of NET release over time (n = 5). Statistics were performed on t = 240 min. (c) Citrullinated nucleosome detection in NET harvest at t = 240 min. (d) A23187-induced NET release at t = 240 min in the absence (No Ab) or presence of cIgG or CIT-013. (e) Dose-dependent inhibition of A23187-induced NET release with CIT-013 (n = 3). Data were normalized to cIgG (set as 100% NET release). (f) PMA-induced NET release at t = 240 min in the absence or presence of cIgG or CIT-013. (g) Immune complex-induced NET release at t = 240 min in the presence of cIgG or CIT-013. A23187-induced NET release in the absence or presence of CIT-013 in combination with RF (h) or ACPA-rich pool of IgG from RA patients (i) at t = 60 and 180 min, respectively. Concentrations in (i) represent the level of ACPA present in the assay, not the level of IgGs. **P<.01, ***P<.001, and ****P<.0001, Repeated measures one-way ANOVA with Dunnett’s (b) or Tukey’s (d) multiple comparisons test, Friedman test with Dunn’s multiple comparisons test (c), two-tailed Wilcoxon matched-pairs signed rank test (g), and ordinary two-way ANOVA with Dunnett’s multiple comparisons test (h and i).