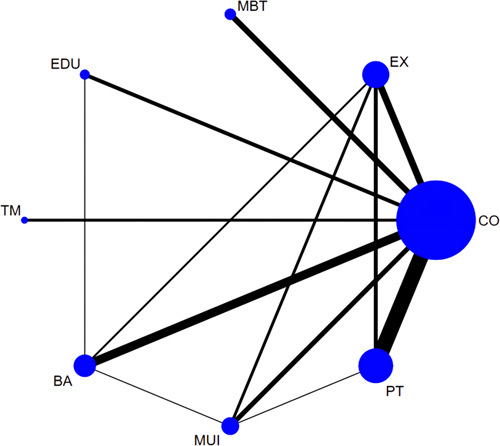
Figure 3.

Network plot of comparisons in the network meta-analysis of different categories of interventions for depression. Nodes’ sizes and line widths represent the number of randomized patients and controlled trials for each treatment, respectively. The size of the node corresponds to the number of patients randomized to each treatment, whereas the line width indicates the number of randomized controlled trials comparing each pair of treatments. BA, biopsychosocial approach; CO, control; EX, exercise; EDU, education; MBT, mind body therapy; MUI, multicomponent intervention; PT, physical therapy; TM, telemedicine. Interventions details are described in Appendix 3 (Supplemental Digital Content 5, http://links.lww.com/JS9/B123).
