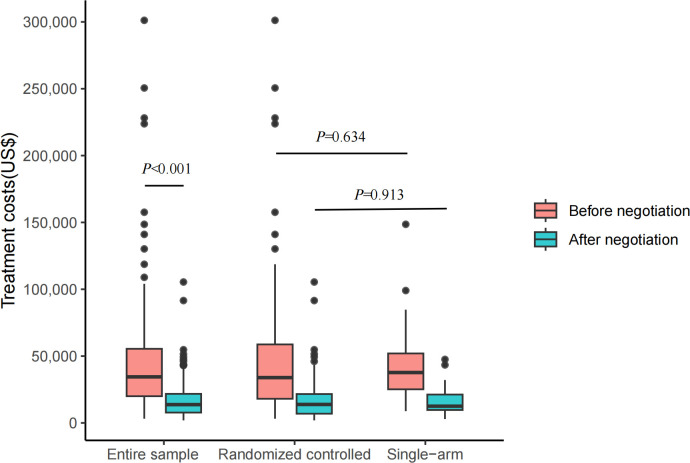
Fig 2. Treatment costs over expected durations for indications both before and after negotiation in China.
This boxplot shows costs over expected treatment durations of indications over the entire sample (N = 103), of indications supported by randomized controlled trials (N = 76), and of indications supported by single-arm clinical trials (N = 27), both before and after negotiation. Entire sample = indications supported by both randomized controlled trials and single-arm clinical trials; randomized controlled = indications supported by randomized controlled trials; and single-arm = indications supported by single-arm clinical trials. Pink color represents indications before negotiation, while blue-green color represents indications after negotiation. Asymptotic P values were attached to show group differences. The box displays the median and IQR. The band near the middle of the box is the median, and the bottom and top of the box are the first and third quartiles (the 25th and 75th percentiles, respectively). The solid lines below and above the box describe the bottom and top whiskers. The small dots indicate extreme outliers. IQR, interquartile range.

