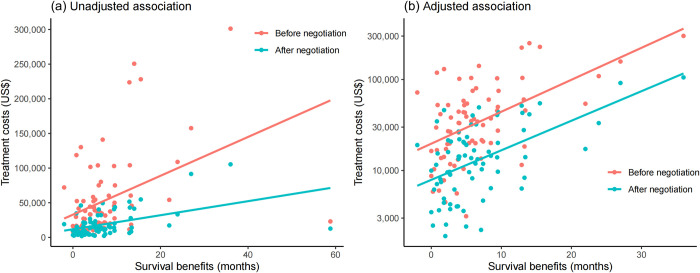
Fig 3. Associations between treatment costs and survival benefits for indications supported by randomized controlled trials.
Fig 3A displays the raw data of 76 indications supported by randomized controlled trials, illustrating the unadjusted association between treatment costs and survival benefits. Fig 3B depicts the adjusted association between treatment costs and survival benefits for 75 indications after excluding the extreme outliers and log-transforming treatment costs based on data distribution. Notably, the Y-axis scale for treatment costs in Fig 3B has been log-transformed, while the axis labels display the original values for a clearer visual representation. Pink dots represent indications before negotiation, while blue-green dots represent indications after negotiation. Lines indicate the associations between treatment costs and survival benefits, with a pink line for the association before negotiation and a blue line for the association after negotiation.

