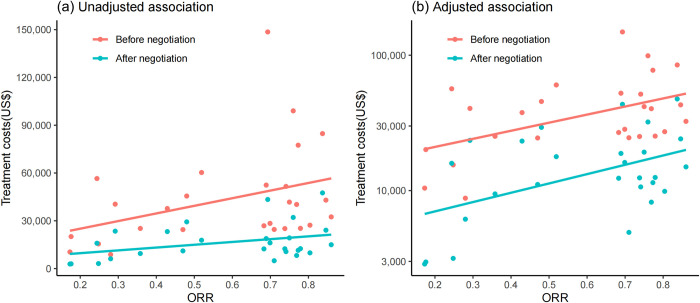
Fig 4. Associations between treatment costs and overall response rates for indications supported by single-arm clinical trials.
ORR, overall response rates. Fig 4A displays the raw data of 27 included indications supported by single-arm clinical trials, illustrating the unadjusted association between treatment costs and ORR. Fig 4B depicts the adjusted association between treatment costs and ORR after log-transforming treatment costs based on data distribution. Notably, the Y-axis scale for treatment costs in Fig 4B has been log-transformed, while the axis labels display the original values for a clearer visual representation. Pink dots represent indications before negotiation, while blue-green dots represent indications after negotiation. Lines indicate the association between treatment costs and ORR, pink line for the association before negotiation and blue line for the association after negotiation.

