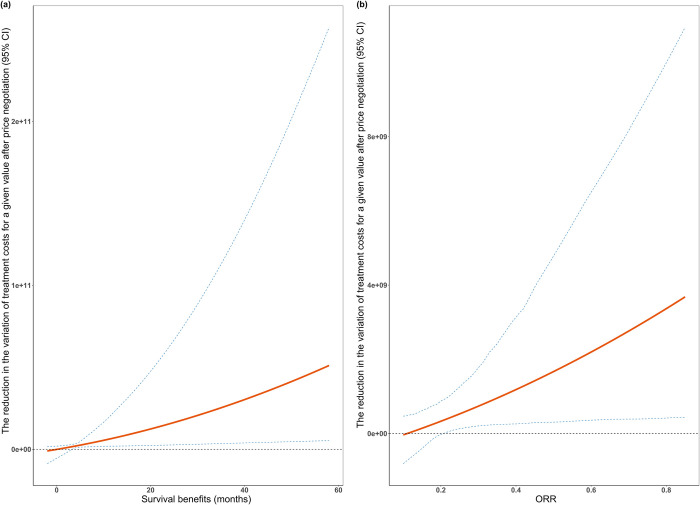
Fig 5. Reductions in the variation of treatment costs for a given value after price negotiation.
ORR, overall response rates. Fig 5a shows the survival benefits and the reduction in the variation of treatment costs for a given survival after price negotiation for indications supported by randomized controlled trials. Fig 5b shows the ORR and the reduction in the variation of treatment costs for a given ORR after price negotiation for indications supported by single-arm clinical trials. The red line represents the reduction in the variation of treatment costs after price negotiation for a given value, and the blue dotted lines represent the 95% CI.

