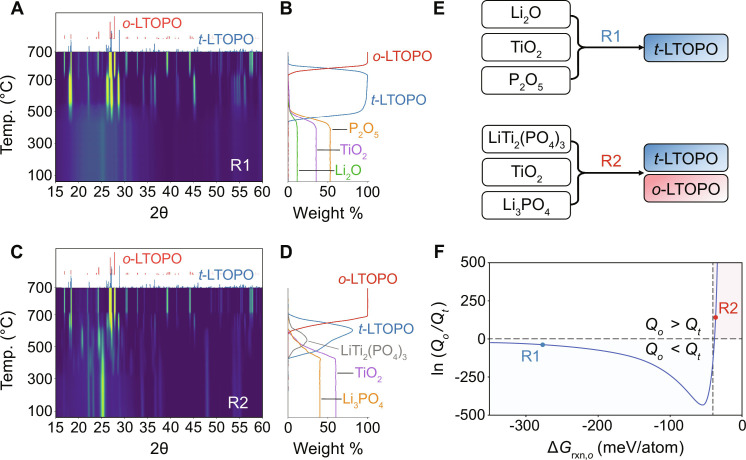
Fig. 3. Phase evolution and polymorph selection during solid-state synthesis of LTOPO.
(A and C) In situ synchrotron XRD patterns (2θ converted to Cu Kα) measured while heating to 700°C, followed by a 3-hour hold, using starting precursors of (A) Li2CO3, TiO2, and P2O5 or (C) Li2CO3, TiO2, and NH4H2PO4. (B and D) Phase fraction evolution estimated from the peak intensity in (A) and (C), respectively. Amounts of amorphous phases were calibrated based on the starting materials. (E) Reaction pathways denoted R1 and R2 correspond to the results shown in (A) and (C), respectively. (F) Relative polymorph nucleation rates between o-LTOPO and t-LTOPO as a function of reaction energy (ΔGrxn,o). The minimum thermodynamic driving force required to form the metastable t-LTOPO is denoted by . The two points (R1, R2) along the curve represent different reactant combinations that led to the initial formation of LTOPO.

