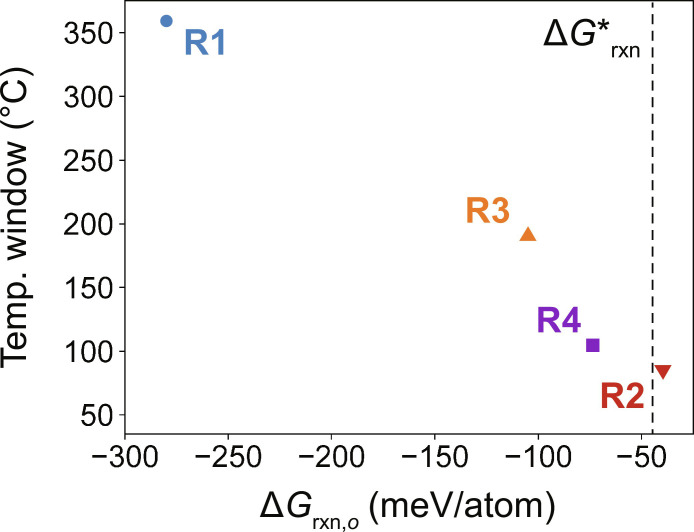
Fig. 4. Correlation between t-LTOPO stability window and reaction energy.
The temperature window over which t-LTOPO is observed, plotted with respect to the reaction energy, for each precursor set tested here. This includes R1: Li2O + TiO2 + P2O5, R2: LiTi2(PO4)3 + TiO2 + Li3PO4, R3: Li3PO4 + TiO2 + P2O5, and R4: LiTi2(PO4)3 + Li2TiO3. The vertical dashed line represents the critical reaction energy, below which o-LTOPO formation is predicted to be favorable.

