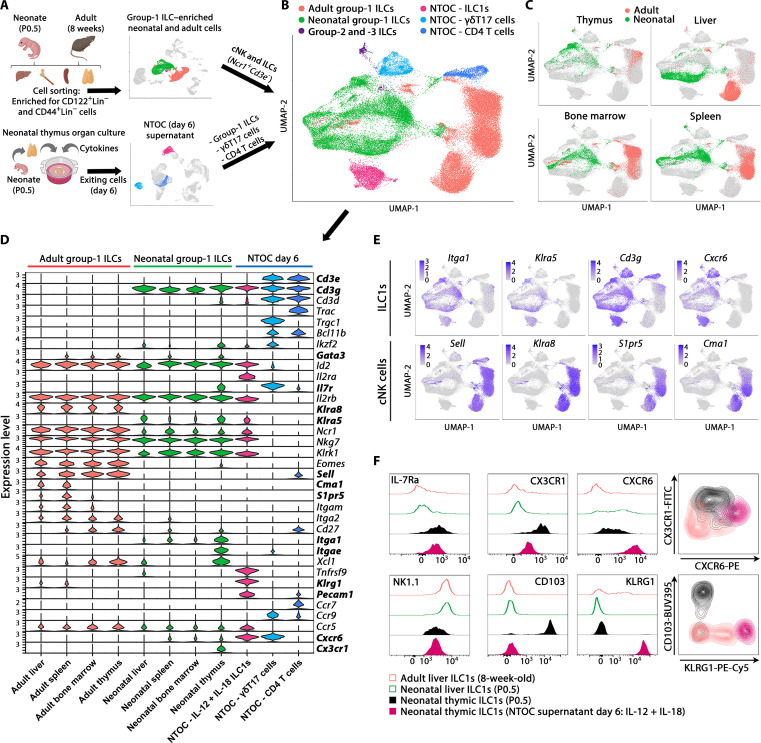
Fig. 4. Thymic ILC1s shift expression from CX3CR1 to CXCR6 upon IL-12 + IL-18 stimulation.
(A) Schematic of scRNA-seq strategy to extract the liver, bone marrow, spleen, and thymus from P0.5 neonates and 8-week-old adult mice. Group-1 ILC cell enrichment was performed, and CD122+Lin− cells and CD44+Lin− cells were sorted for the enrichment of group-1 ILCs (ILC1s and cNK cells) and progenitor cells from each organ. The resulting eight scRNA-seq datasets were combined, and from these, the clusters primarily containing ILC1s and cNK cells (identified by Ncr1+Cd3e− expression) were selected for downstream analysis. In addition, three clusters from the scRNA-seq data in Fig. 1 were selected from the combined four conditions of NTOC supernatant for integration with the new single-cell data: (i) ILC1s (IL-12 + IL-18), (ii) γδT17 cells, and (iii) CD4 T cells. The two T cell clusters were chosen as internal controls. (B) UMAP of Harmony-integrated data with the same colors as in (A), showing the six major groupings divided on the basis of sample origin and gene expression in the case of group-2 and group-3 ILCs. (C) UMAP visualization of cells derived from the four tissues green (neonates) and red (adults). (D) Violin plots showing gene expression of curated genes with colors based on (B), showing the group-1 ILCs and the eight different tissues of origin and the three NTOC clusters. (E) Feature plots of ILC1 markers (top row) and cNK cell markers (bottom row). (F) Flow cytometry comparison of ILC1s across tissues (CD122+NK1.1+CD49a+CD62L−Lin−) from adult liver (8 weeks old), neonatal liver and thymus (P0.5), and IL-12 + IL-18–stimulated NTOC supernatant (day 6), displayed as histograms with thymus-derived ILC1s (closed) and liver ILC1s (open) or density plots (gating shown in fig. S4C). Histograms and density plots are representative of n = 6 biological replicates per condition from two independent experiments. FITC, fluorescein isothiocyanate; PE, phycoerythrin.

