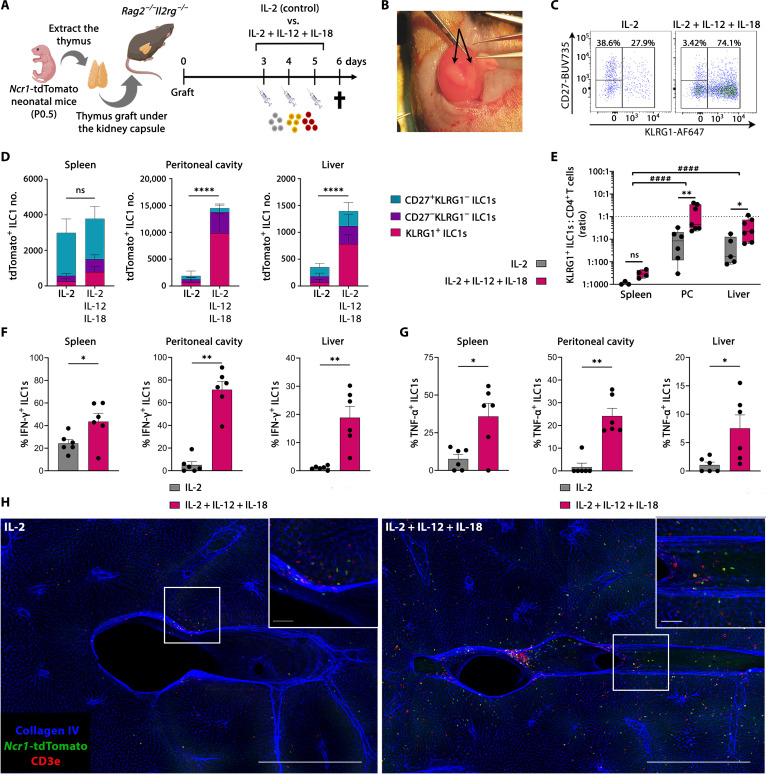
Fig. 7. KLRG1+ thymic ILC1s are homing to the liver and the peritoneal cavity.
(A) Schematic of neonatal Ncr1-tdTomato thymus graft experiments. (B) Picture of a kidney with two recently grafted neonatal thymic lobes (arrows). (C) Representative flow plots of tdTomato+ ILC1s from the peritoneal cavity. (D) Stacked bar plots showing total thymic graft–derived ILC1s divided on the basis of CD27 and KLRG1 expression in the indicated organs [gating shown in (C) and fig. S7A]. Error bars are shown as SEM. (E) Count ratio (log10 scale) between thymus graft–derived KLRG1+ ILC1s and CD4 T cells for determining differential homing in indicated tissues. Data are shown as box-and-whiskers plots displaying median, minimum, and maximum. (C) and (E) Data are pooled from two independent experiments from n = 3 to 4 (spleen), n = 6 to 7 (peritoneal cavity), and n = 5 to 7 (liver) and representative of four independent experiments. (F and G) Intracellular cytokine expression showing the percentage of thymus graft–derived ILC1 population actively expressing (F) IFN-γ or (G) TNF-α in indicated organs (gating shown in fig. S7H). Data are pooled from two independent experiments with n = 6 mice per condition. Error bars are shown as SEM. (E) to (G) Each symbol represents an individual mouse. (H) Confocal 3D imaging of 500-μm-thick liver samples from thymus-grafted mice. Representative pictures are shown as maximum projection intensity. Blue, collagen IV; green, Ncr1-tdTomato; red, CD3e. Scale bars, 500 μm (bottom right corner) and 50 μm (zoomed-in section). Images are representative of n = 3 to 4 from two independent experiments. Statistical significance was calculated by (D) unpaired t test (total cell count), (E) two-way ANOVA between treatments and tissues, [(F) and (G); except spleen IFN-γ] Kruskal-Wallis test, and [(F); spleen IFN-γ] unpaired t test, *P < 0.05, **P < 0.01, and ****P < 0.0001. (E) Two-way ANOVA between tissues, ####P < 0.0001.

