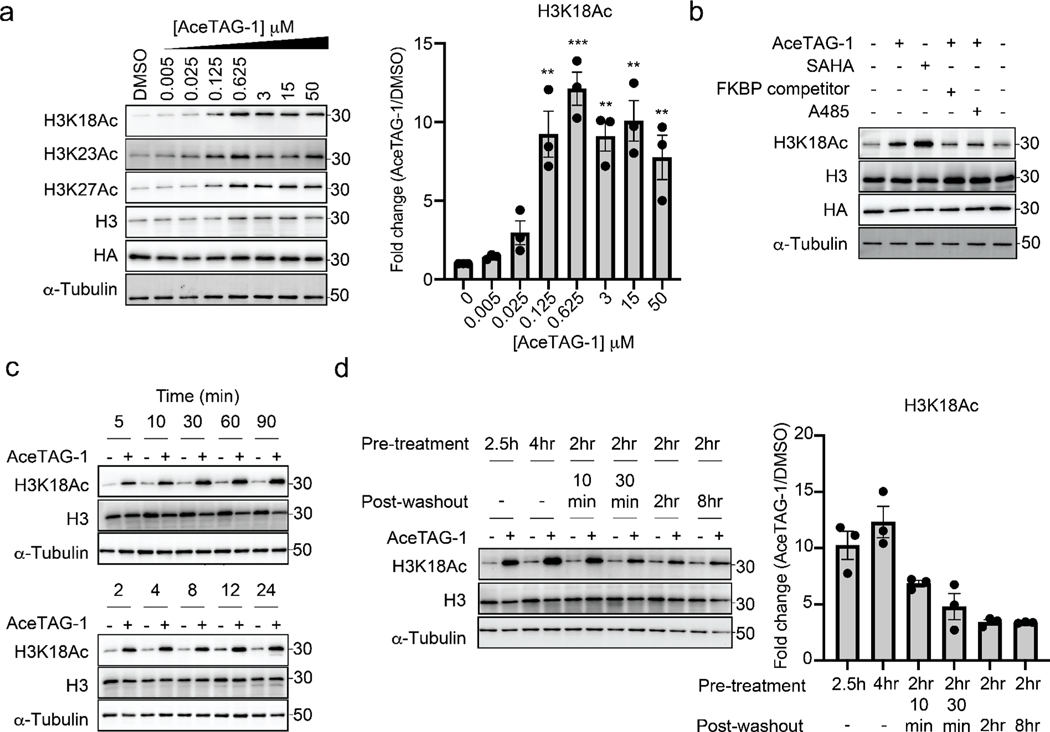
Figure 2.
AceTAG molecules induce rapid, targeted acetylation of H3.3-FKBP12F36V in cells. (a) Concentration-dependent acetylation of H3.3FKBP12F36V lysine residues by AceTAG-1. H3.3-FKBP12F36V HeLa cells were treated with increasing concentrations of AceTAG-1 for 2 h, and acetylation of K18, K27, and K23 was monitored by immunoblot. Shown in the right panel is quantitation of immunoblot signal of K18Ac relative to α-tubulin as the mean ± s.e.m. of n = 3 biologically independent experiments. Statistical significance was calculated with unpaired two-tailed Student’s t tests comparing DMSO- to AceTAG-1-treated samples. *p < 0.05; **p < 0.01; ***p < 0.001; ****p < 0.0001. (b) Immunoblot analysis of controls for AceTAG-mediated acetylation of H3.3. Cells were treated with the histone deacetylase inhibitor SAHA (5 μM) or co-treated with AceTAG-1 (625 nM) and DMSO, an FKBP12F36V binding ligand (50 μM, Figure S1c), or the p300/CBP KAT domain inhibitor A-485 (1 μM) for 2 h which block AceTAG-1-induced acetylation. The results in (a, b) are representative of two independent biological replicates (n = 2). (c) Immunoblot analysis of AceTAG-1 (625 nM) treated H3.3-FKBP12F36V HeLa cells over the indicated time course. (d) Washout experiments showing decreasing acetylation upon removal of AceTAG-1 from cells. Immunoblot of H3.3-FKBP12F36V HeLa cells pretreated with AceTAG-1 (625 nM) or vehicle for the indicated time, washed with DPBS, and resuspended in fresh media (without AceTAG-1) for the indicated time. Shown in the right panel is quantitation of immunoblot signal of K18Ac relative to α-tubulin as the mean ± s.e.m. of n = 3 biologically independent experiments. The results in (c, d) are representative of three independent biological replicates (n = 3). Full images of blots are shown in Figures S7 and S8.

