Figure 4.
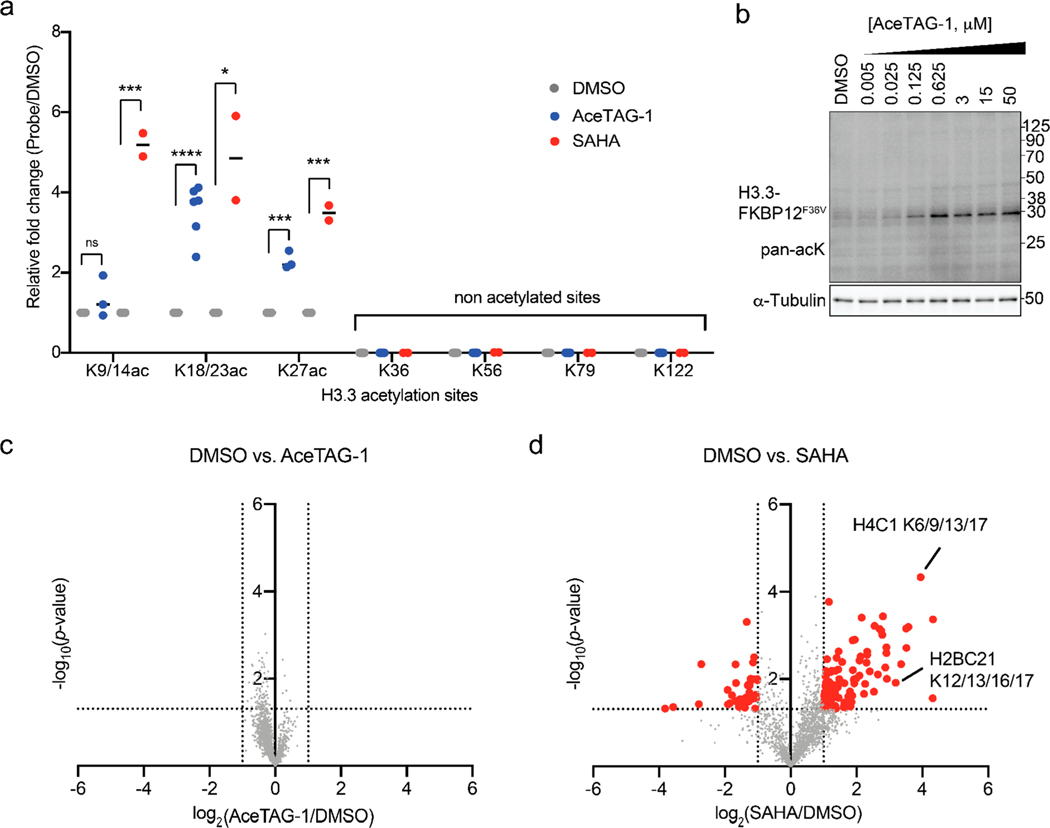
Chemically induced acetylation selectivity assessment using quantitative proteomics. (a) Fold changes in H3.3 acetylated lysine abundances of H3.3-FKBP12F36V HeLa cells treated with AceTAG-1. Cells were treated with DMSO, AceTAG-1 (625 nM), or SAHA (5 μM) for 2 or 24 h and lysed; H3.3 was enriched, trypsinized, and labeled with isobaric TMT reagents and then subjected to quantitative MS (outlined in Figure S3a and Table S1). Data represent a median of n = 6 biological replicates for AceTAG-1-treated cells and a median of n = 2 biological replicates for SAHA-treated cells. Note that peptides may not have been detected in every replicate but are required to be detected and quantified in at least two biological replicates to be included in this analysis. No acetylation was detected for K36, K56, K79, and K122. Statistical significance was calculated with unpaired two-tailed Student’s t tests comparing DMSO- to AceTAG-1- or SAHA-treated samples. *p < 0.05; ***p < 0.001; ****p < 0.0001. See Figure S4b for representative spectra. (b) AceTAG-1 does not induce broad changes in acetylation as indicated by immunoblot analysis of H3.3-FKBP12F36V HeLa cells treated with increasing concentrations of AceTAG-1 by using a pan acetyl-lysine antibody. The results are representative of three independent biological replicates (n = 3). Full images of blots are shown in Figure S11. (c, d) Volcano plots showing that AceTAG-1 does not induce broad changes in acetylation in the proteome as determined by quantitative MS. H3.3-FKBP12F36V HeLa cells treated with DMSO, AceTAG-1 (600 nM, c), or SAHA (2 μM, d) for 2 or 16 h, lysed, trypsinized, and acetylated peptides enriched and labeled with TMT reagents, and then subjected to quantitative MS (Table S1). The vertical dashed lines correspond to 2-fold change in enrichment relative to DMSO, and the horizontal line corresponds to a P value of 0.05 for statistical significance. Red circles correspond to protein targets with >2-fold change (P < 0.05) relative to DMSO. Each point represents an individual acetylated peptide plotted as a mean of n = 3 biological replicates for DMSO and AceTAG-1 treatments and n = 2 biological replicates for SAHA treatments combined in one TMT 10-plex experiment. An independent replicated TMT experiment is shown in Figure S5. Examples of histone-derived sites with increased acetylation upon SAHA treatment are noted in (d).

