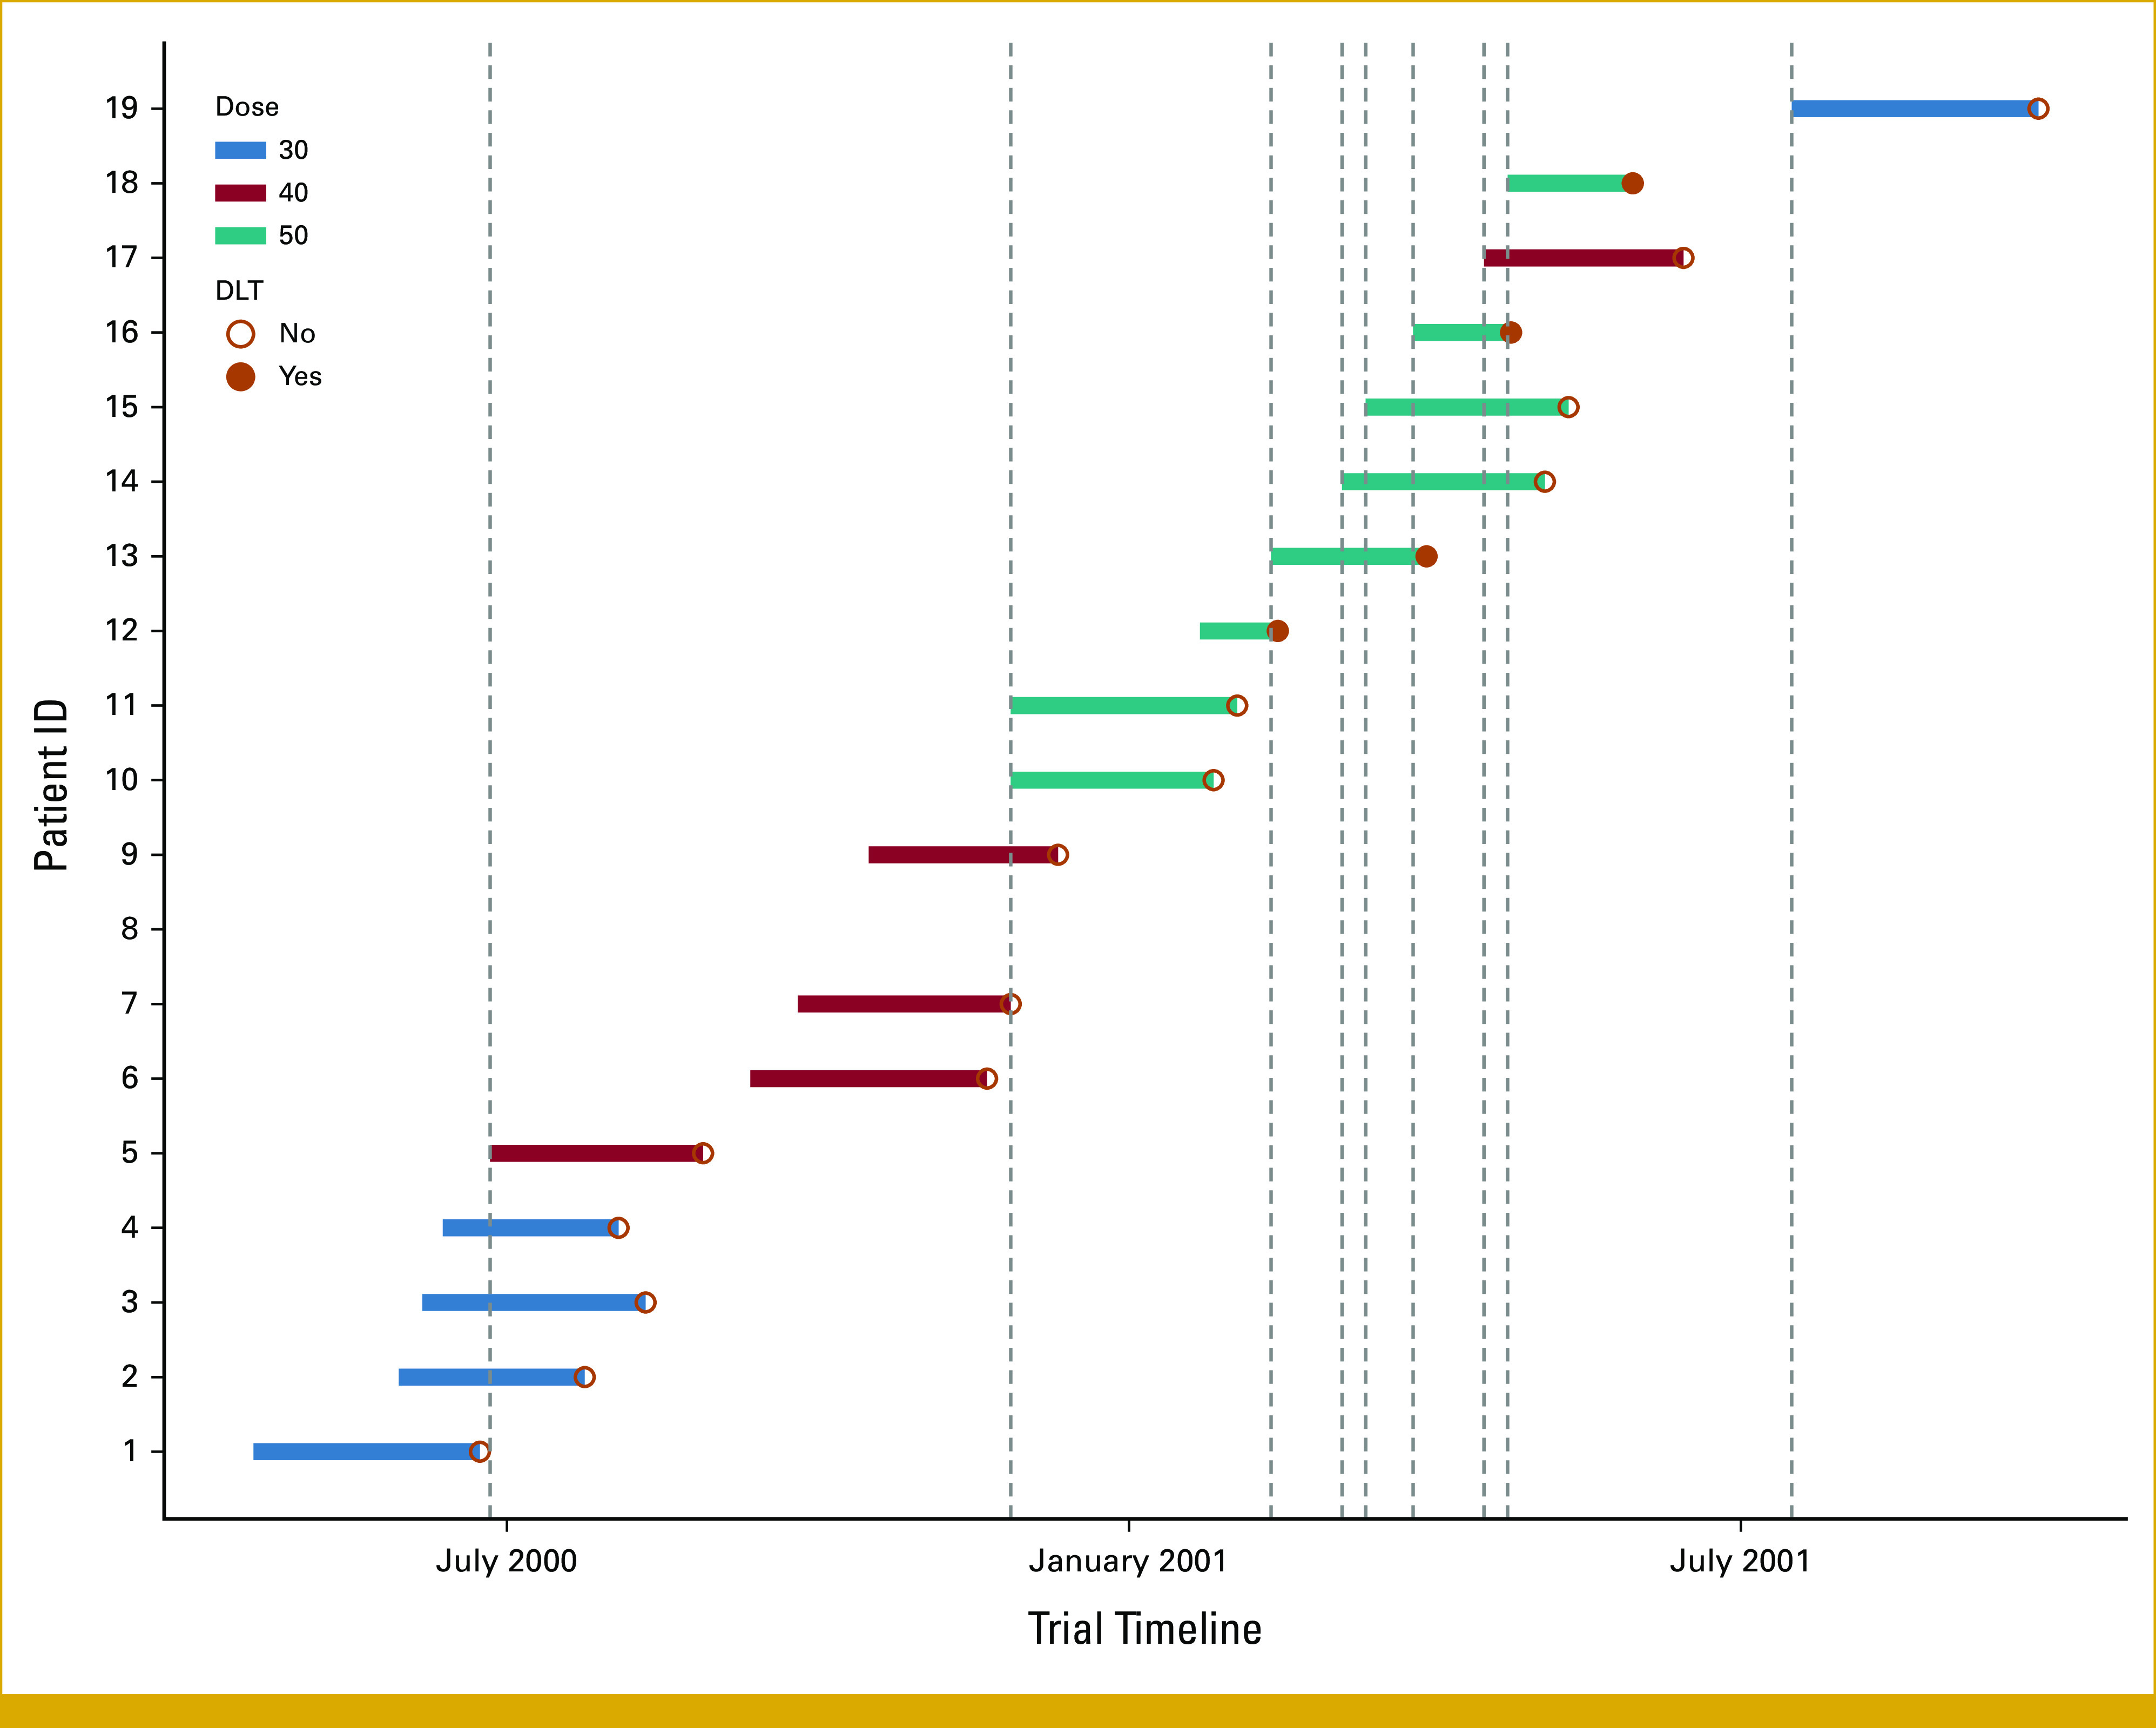
FIG 3.

A swimmer plot illustrating dosage received, the presence of DLT, and the DLT follow-up period for evaluable participants. The vertical lines suggest when each interim analysis had been performed to assign doses for subsequent participants. DLT, dose-limiting toxicity.
