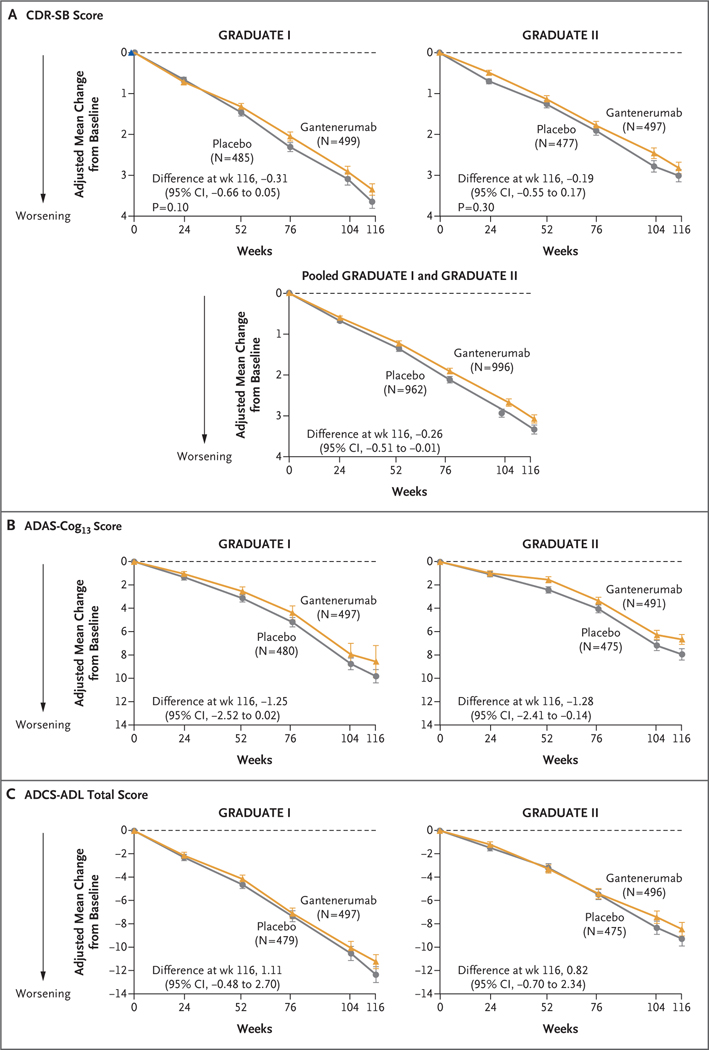
Figure 2 (facing page). Clinical Outcomes.
Shown is the adjusted mean change from baseline in the score on the Clinical Dementia Rating scale-Sum of Boxes (CDR-SB; range, 0 to 18, with higher scores indicating greater cognitive impairment) (Panel A), in the score on the 13-item cognitive subscale of the Alzheimer’s Disease Assessment Scale (ADAS-Cog13; range, 0 to 85, with higher scores indicating greater cognitive impairment) (Panel B), and in the total score on the Alzh eimer’s Disease Cooperative Study-Activities of Daily Living Inventory (ADCS-ADL; range, 0 to 78, with lower scores indicating greater functional impairment) (Panel C) through week 116. I bars indicate 95% confidence intervals. The analyses were performed with conditional mean imputation followed by analysis of covariance. The primary outcome was the change from baseline in the CDR-SB score at week 116; secondary outcomes included the change from baseline in the ADAS-Cog13 and ADCS-ADL scores at week 116. Data are shown for participants who had available baseline values for a given outcome.

