FIGURE 2.

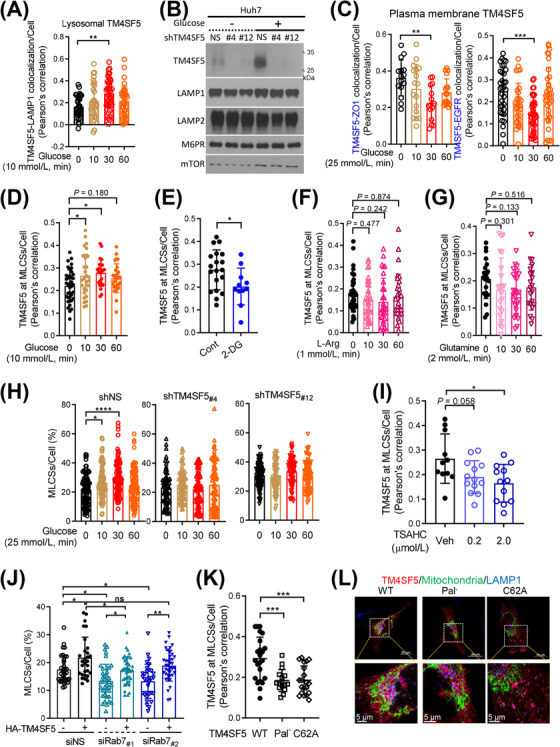
Extracellular glucose repletion caused TM4SF5 translocation to MLCSs. (A) SNU449 cells transfected with mCherry‐TM4SF5 and LAMP1 labelling were glucose starved for 16 h and then replete with 10 mmol/L glucose for various periods before LAMP1 fluorescence imaging using a confocal microscope. TM4SF5‐LAMP1 colocalization was determined by Pearson's correlation. Each data point depicts a correlation value per cell, and each experimental condition included measurements from multiple cells (n = 34, 30, 38, 34 cells per experimental condition, respectively). (B) Huh7 cells stably transfected with non‐specific shRNA (shNS), shTM4SF5 #4, or shTM4SF5 #12 were glucose depleted (16 h) and then replete with 25 mmol/L glucose (30 min) before lysosome isolation by ultracentrifugation for immunoblots. (C) Cells manipulated as in (A) were imaged for TM4SF5 colocalization with ZO1 or EGFR at plasma membranes. (D‐E) Fluorescence in SNU449 cells transfected with mCherry‐TM4SF5 and mito‐GFP were treated with different glucose levels in RPMI‐1640 culture media for the indicated time and then confocally imaged for quantification of TM4SF5 at MLCSs/cell by Pearson's correlation (D), or quantification of them without or with 2‐DG treatment (25 mmol/L, 30 min; E). (F‐G) SNU449 cells manipulated as in (A) were L‐arginine‐depleted (for 16 h) and then replete (1 mmol/L for various times, F) or glutamine‐depleted (for 16 h) and then replete (2 mmol/L glutamine for various times, G), before quantification of TM4SF5 at MLCSs per cell. (H) Huh7 cells stably transfected with shNS, shTM4SF5 #4, or shTM4SF5 #12 together with mito‐GFP constructs and lysotracker labeling were glucose‐depleted for 16 h and then replete with 25 mmol/L glucose for various periods before quantification of MLCSs/cell. (I) SNU449 cells as in (E) were rather treated with TSAHC for 24 h before quantification of TM4SF5 at MLCSs per cell. (J) Quantifications of MLCSs/cell were done from SNU449 (‐EV or ‐TM4SF5) cells transfected with non‐specific siRNA (siNS) or Rab7 siRNA (siRab7 #1 or siRab7 #2) together with mito‐GFP and lysotracker labelling. (K‐L) SNU449 cells transfected with HA‐TM4SF5 WT, Pal− mutant, or C62A mutant and mito‐GFP were stained for HA (red) and LAMP1 (blue) before imaging (L) and calculation of TM4SF5 at MLCSs per cell (K). Each datapoint indicates a measurement per cell. * P < 0.05, ** P < 0.01, *** P < 0.001, **** P < 0.0001, ns = non‐significant, unpaired Student's t tests or ordinary one‐way ANOVA. Data were represented as mean ± SD. Data represent three independent experiments. See also Supplementary Figure S2. L‐arg, L‐arginine; MLCS, mitochondria‐lysosome contact site; Rab7, member 7 of the RAB family of small GTPases; shRNA, short hairpin RNA; TM4SF5, transmembrane 4 L six family member 5.
