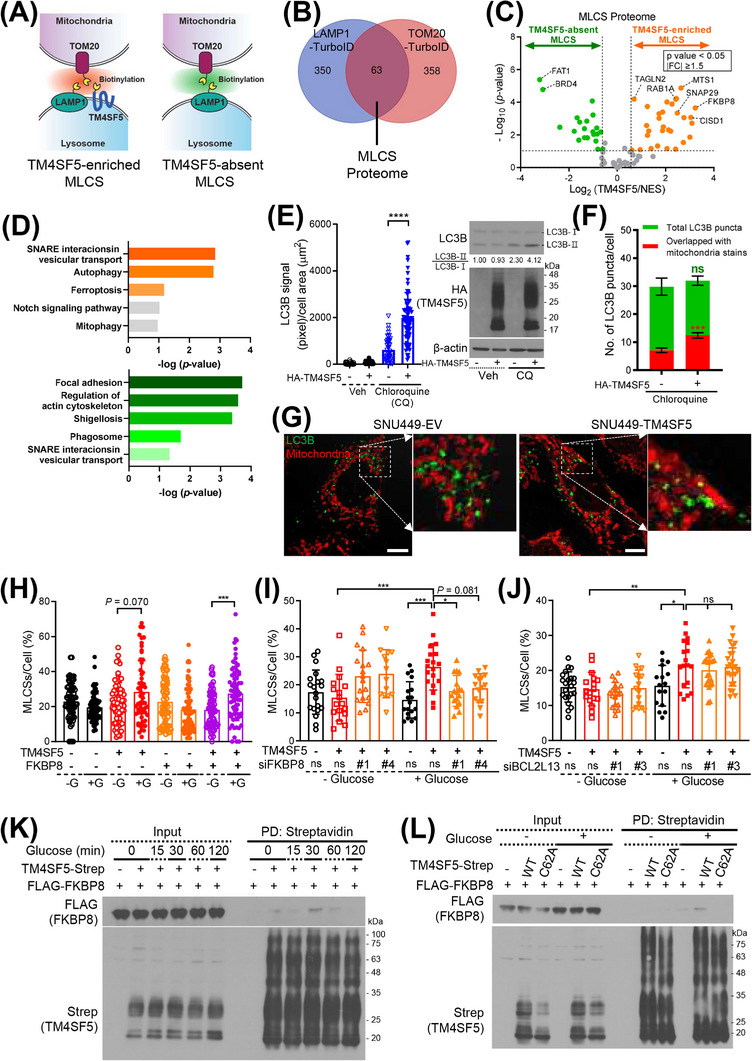
FIGURE 3.

TM4SF5‐FKBP8 linkage at MLCSs. (A) Schematic of TurboID (TM4SF5‐v5‐, LAMP1‐v5‐, or TOM20‐v5‐TurboID) transfected into Huh7 cells to show MLCSs. (B) Venn diagram to show proteins clustered to TOM20‐v5‐TurboID or LAMP1‐v5‐TurboID. (C) Protein clusters at TM4SF5‐absent or TM4SF5‐enriched MLCSs after normalization of TM4SF5‐v5‐TurboID protein clusters to NES‐v5‐TurboID clusters. (D) KEGG pathways for TM4SF5‐enriched (upper panel) or TM4SF5‐absent (lower panel) MLCS protein clusters. (E‐G) SNU449 cells stably transfected with HA‐empty vector (EV) or HA‐TM4SF5 were treated with 10 μmol/L CQ for 24 h without (E; n = 32, 49, 43, or 70) or with mitotracker labeling (500 nmol/L, 30 min; F; n = 20 or 27), before anti‐LC3B immunofluorescent staining or immunoblotting (E, right). Confocal images (G) were captured, and intensities of total or mitochondrial LC3B signal (F) were analyzed. **** P < 0.0001, ordinary one‐way ANOVA (E) and *** P < 0.001, two‐tailed unpaired t test (F). (H‐J) Quantification of MLCSs/cell of SNU449 cells transfected with HA‐EV or HA‐TM4SF5, FLAG‐FKBP8, and mito‐GFP (H), or with HA‐EV or HA‐TM4SF5, mito‐GFP, and non‐specific siRNA (siNS) or siRNA for FKBP8 (siFKBP8 #1 or siFKBP8 #4, I) or BCL2L13 (BCL2L13 #1 or siBCL2L13 #3, J) were glucose‐starved and then replete as above before lysotracker labeling. Cell number n was 73, 73, 74, 68, 73, 68, 73, or 62 (H), 20, 17, 18, 14, 18, 19, 17, or 15 (I), or 22, 17, 19, 17, 16, 18, 21, or 24 (J) from left to right conditions. * P < 0.05, ** P < 0.01, *** P < 0.001, or **** P < 0.0001, ns = non‐significant, ordinary one‐way ANOVA. (K‐L) SNU449 cells transfected with TM4SF5‐strep and FLAG‐FKBP8 (K) or with either TM4SF5‐strep WT or C62A mutant and FLAG‐FKBP8 (L) were manipulated as above. Whole‐cell lysates were subjected to streptavidin pulldown and immunoblots. Data were represented as mean ± SD. Cell number n and data represent three independent experiments. See also Supplementary Figure S3. BCL2L13, B‐cell lymphoma 2 (BCL2)‐Like 13; CQ, chloroquine; EV, empty vector; FKBP8, FK506‐binding protein family 8; LC3B, microtubule‐associated proteins 1A/1B light chain 3B; MLCS, mitochondria‐lysosome contact site; PD, pulldown; SD, standard deviation; TM4SF5, transmembrane 4 L six family member 5; TurboID, an engineered biotin ligase that uses ATP to convert biotin into biotin‐AMP, a reactive intermediate that covalently labels proximal proteins; WT, wild‐type.
