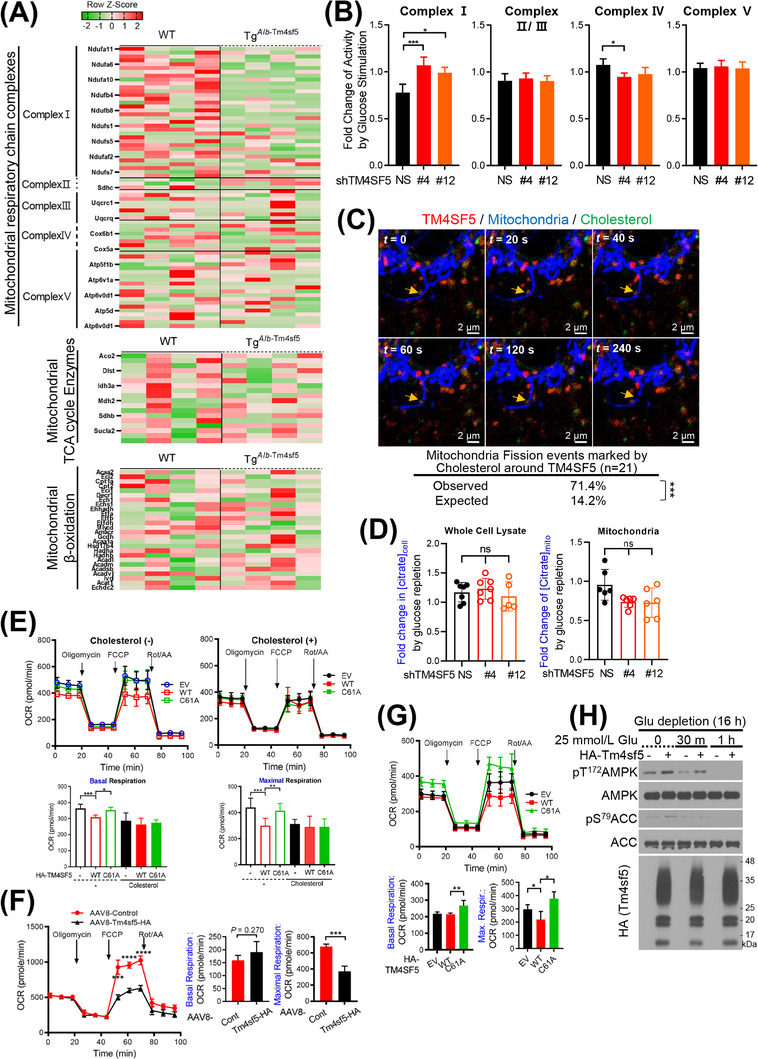
FIGURE 7.

The metabolic effects of TM4SF5‐enriched MLCSs on cellular respiratory reprogramming. (A) Primary hepatocytes isolated from WT or Tg Alb ‐Tm4sf5 C57BL/6N mice (n = 4) were infected with HA‐OMP25 lentivirus. Mitochondria were pulled down using anti‐HA antibody beads for LC/MS proteomics analysis. (B) Huh7 cells with or without TM4SF5 suppression were glucose depleted and replete and processed for ETC complex‐activity assay. FCs in activity between glucose repletion and depletion were graphed as the mean ± SD. (C) SNU449 cells transfected with mCherry‐TM4SF5 and mito‐BFP were treated with 10 μmol/L TopFluor‐cholesterol for 1 h. Representative snapshots from confocal live imaging are presented. Quantitative analysis of the mitochondrial fission events was performed as explained in the Materials and Methods. (D) AML12 cells transfected with the indicated constructs were treated without (‐) or with (+) 16 μmol/L cholesterol for 16 h before OCR measurements. AUCs for the OCR measurements were graphed. (E‐G) Primary hepatocytes from WT or Tm4sf5 −/‐ KO mice (E), WT mice preinjected with AAV8‐control or AAV8‐Tbg‐Tm4sf5 virus (F), or AML12 cells transfected with the indicated constructs (G) were processed for OCR measurements. (H) SNU449 cells stably infected with cDNA plasmids were glucose depleted and replete as indicated before harvests and immunoblots. * P < 0.05, ** P < 0.01, *** P < 0.001, **** P < 0.0001, ns = non‐significant. Data were represented as mean ± SD. Data represent three independent experiments. See also Supplementary Figure S9. AAV8, adeno‐associated virus serotype 8; AUC, area under the curve; ETC, electron transport chain; FC, fold change; KO, knockout; LC/MS, Liquid chromatography/mass spectrometry, AML12, normal murine hepatocytes; MLCS, mitochondria‐lysosome contact site; OCR, oxygen consumption rate; SD, standard deviation; TM4SF5, transmembrane 4 L six family member 5; WT, wild‐type.
