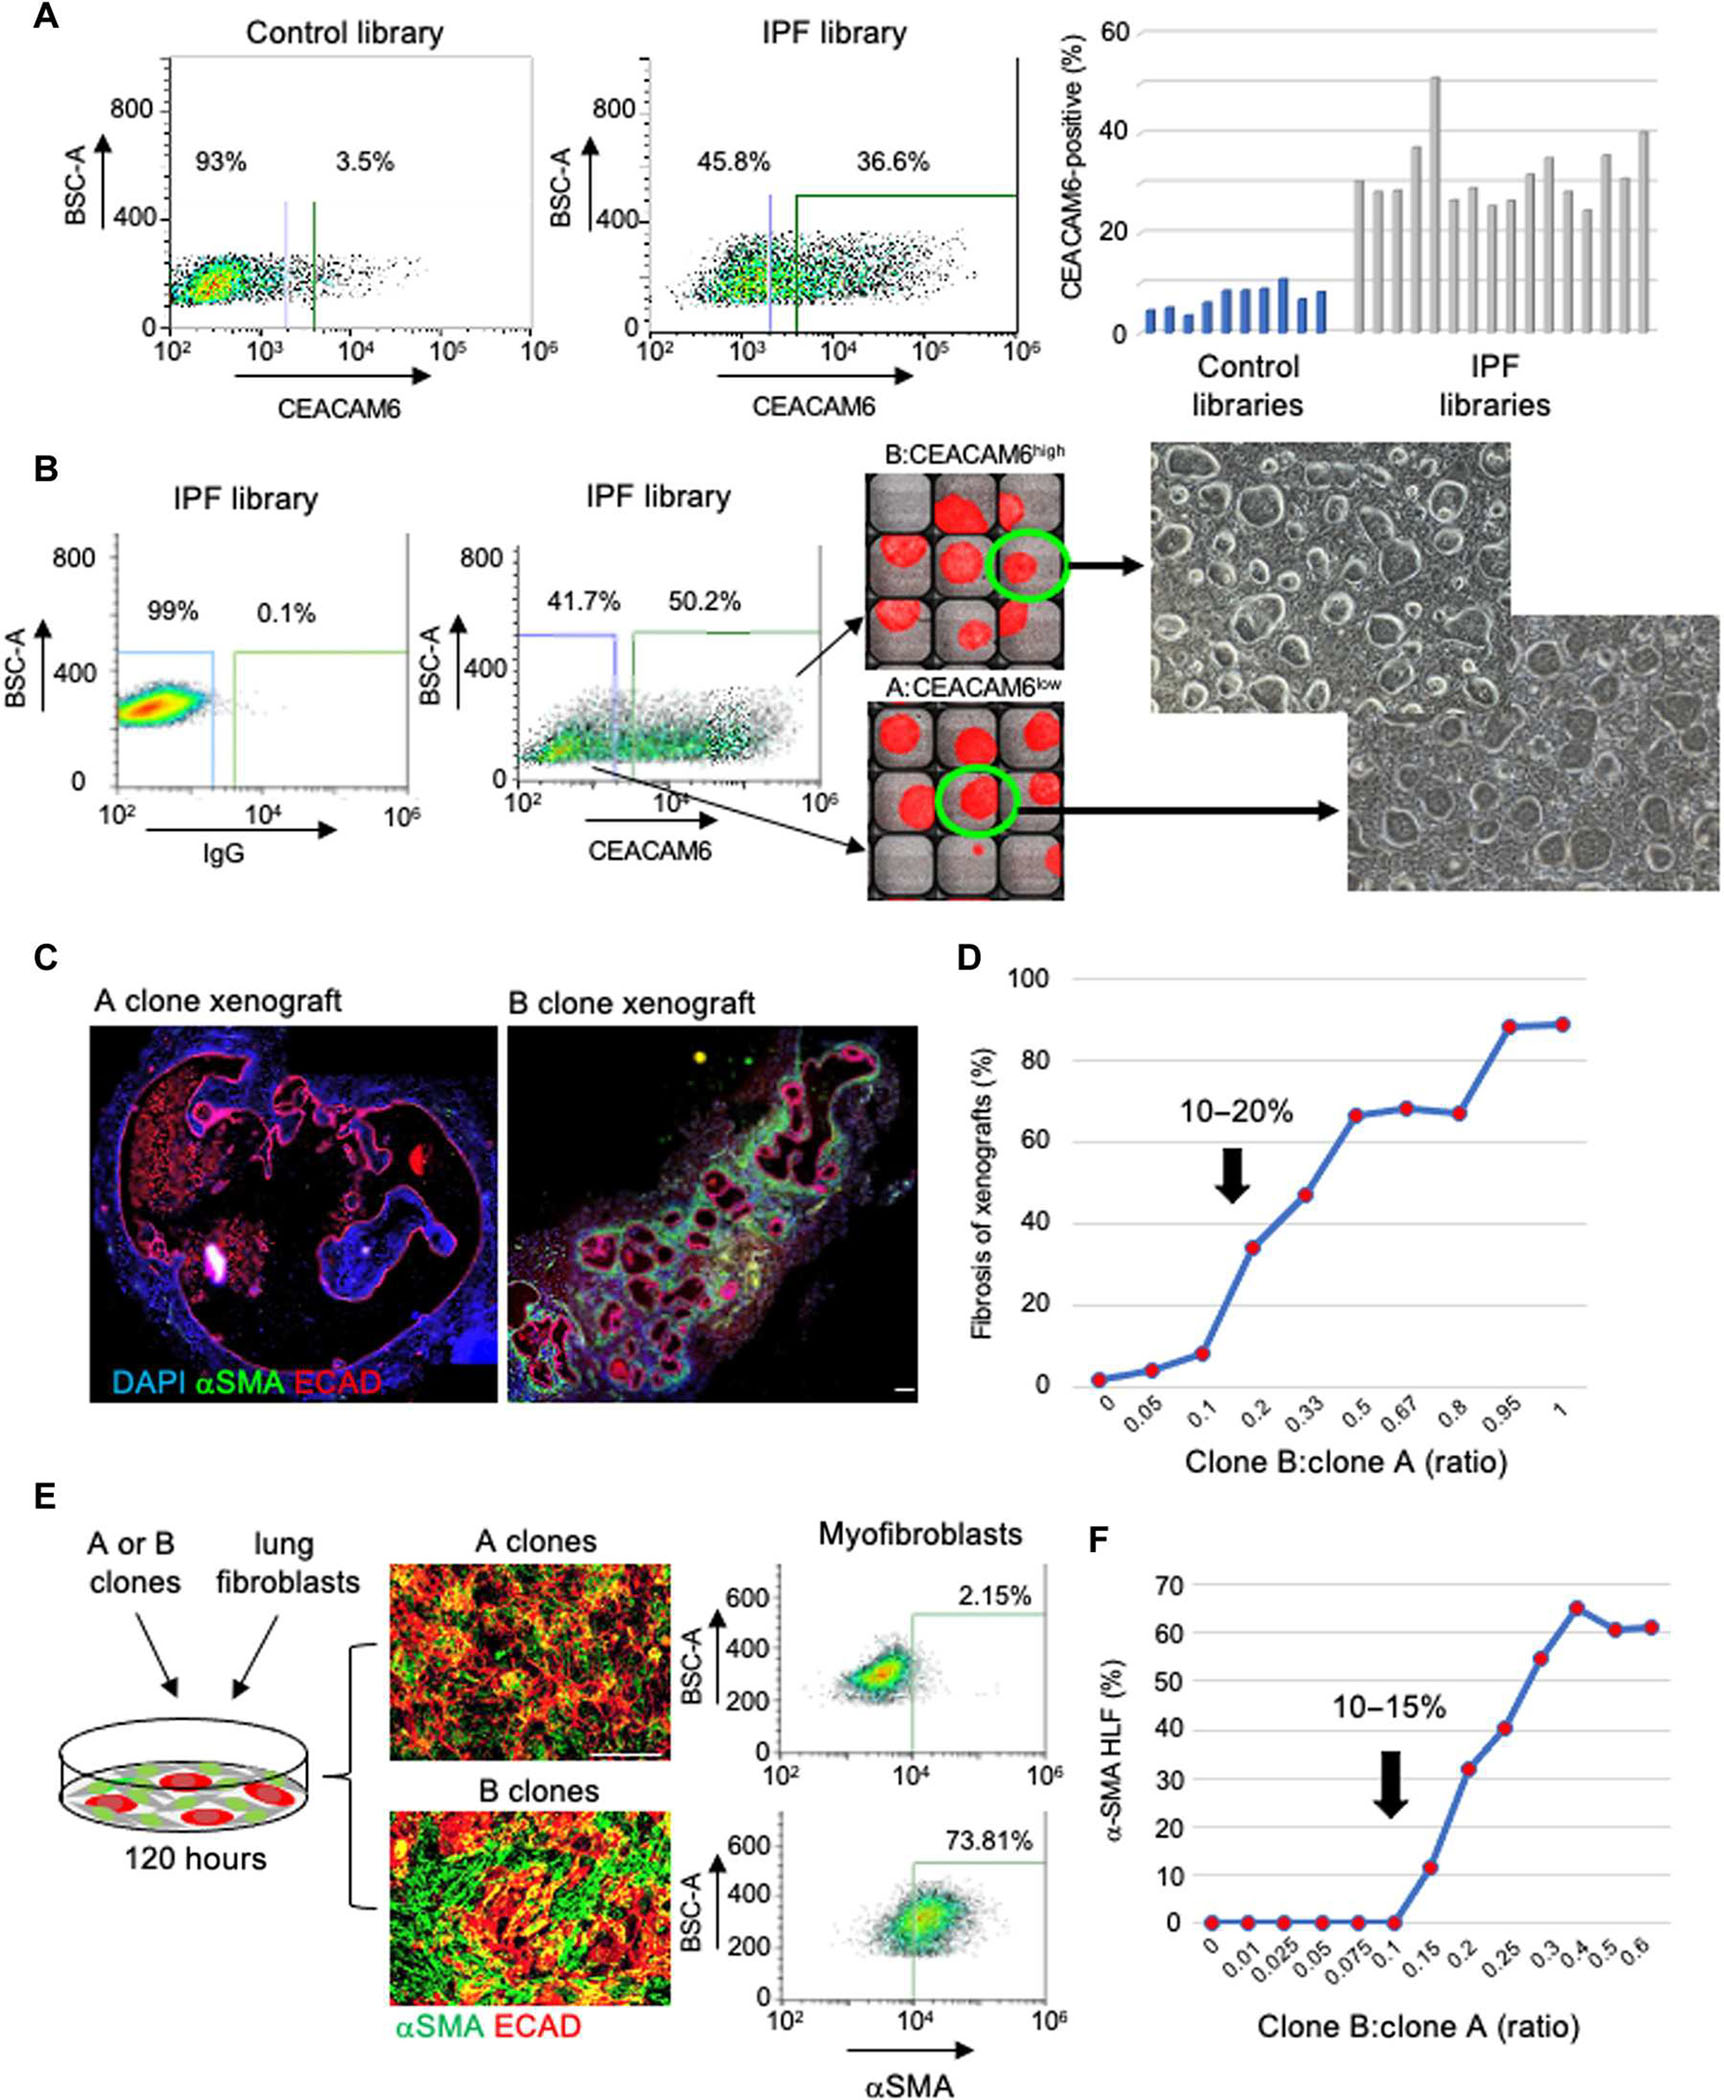
Fig. 2. Cloning a major profibrotic variant from IPF lung.

(A) FACS profiling (left) and a histogram showing the quantification of CEACAM6+ cells in 10 control and 16 IPF stem cell libraries. BSC-A, back scatter area. (B) FACS-aided isolation and single-cell cloning of CEACAM6+ and CEACAM6− cells from IPF basal cell libraries in 384-well plates for clonal expansion. Fluorescein isothiocyanate–mouse immunoglobulin G (IgG) was used as the isotype control. Scale bar, 100 μm. (C) ECAD (red) and αSMA (green) IF on sections of nodules formed from xenografts of A (left) and B clones. Scale bar, 100 μm. (D) Graphical presentation of induction of αSMA+ myofibroblasts by xenograft nodules formed by defined ratios of cells of A and B clones. (E) From left: Schematic of coculture of A or B clones with human normal lung fibroblasts (HLFs), IF images of 72-hour cocultures of clone A + HLF (top) or clone B + HLF (bottom) stained with antibodies to ECAD (red) and αSMA (green), and FACS quantification of the αSMA+ cells in the respective cocultures. Scale bar, 100 μm. (F) Graphical representation of αSMA+ cells quantified by FACS profiling induced by cocultures of human lung fibroblasts with defined ratios of cells from A and B clones.
