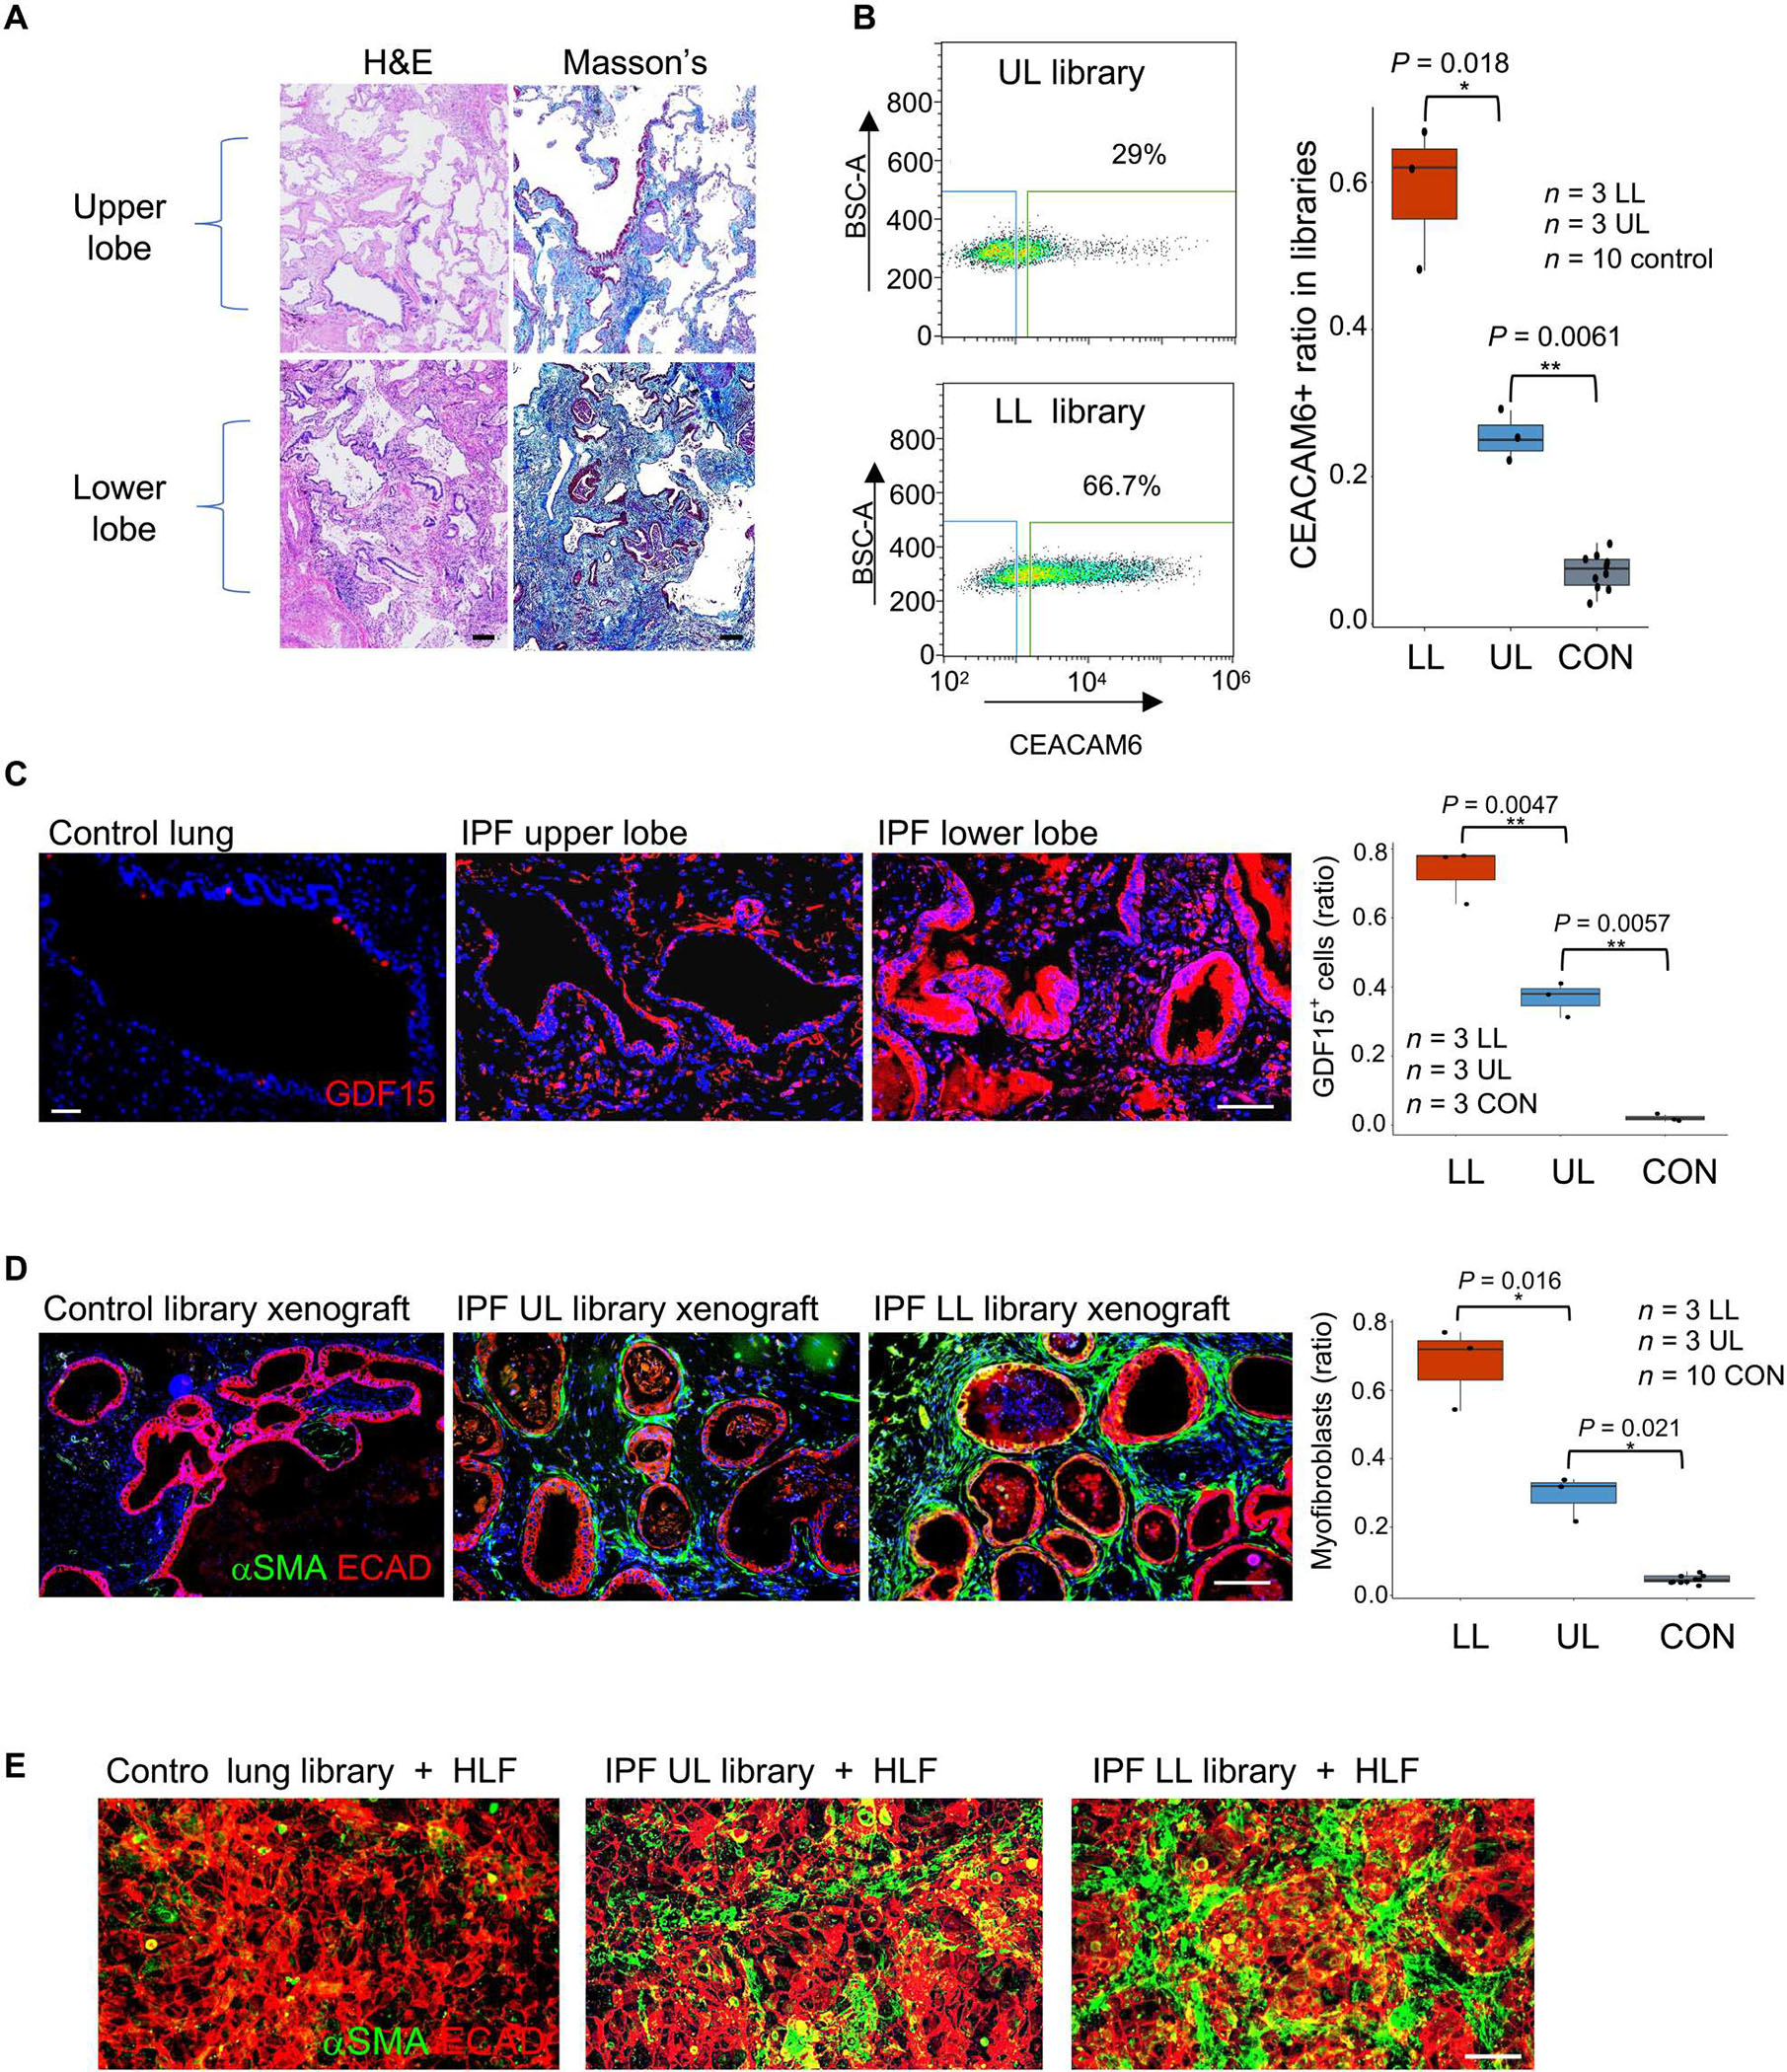
Fig. 3. Cluster B cells in regions of low and high UIP histopathology.

(A) From left: Drawing portraying biased UIP histopathology in lower lobes of IPF lung, patient-matched histological sections of upper (top) and lower (bottom) lung stained with hematoxylin and eosin (H&E) and Masson’s trichrome (collagen; blue). Scale bars, 100 μm. (B) From left: FACS profiling of CEACAM6+ cells from basal cell libraries generated from corresponding regions of upper and lower lung as well as whisker box plot of CEACAM6+ cells in libraries derived from upper and lower lungs from three IPF cases and from 10 control libraries. (C) From left: GDF15 IF in histological sections of control and upper (UL) and lower lobes (LB) of IPF lung as well as whisker box plot quantification of GDF15 fluorescence in sections from 10 control and three IPF patient–matched lower and upper lobes. Scale bars, 100 μm. (D) ECAD (red) and αSMA+ (green) IF of nodule sections from xenografts of basal cell libraries from control and IPF lower and upper lobes as well as whisker box plot presentation of morphometric data across 10 control and three IPF cases. Scale bar, 100 μm. (E) ECAD (red) and αSMA+ (green) IF of 72-hour cocultures of control, upper lobe, and lower lobe libraries with HLFs. Scale bar, 100 μm.
