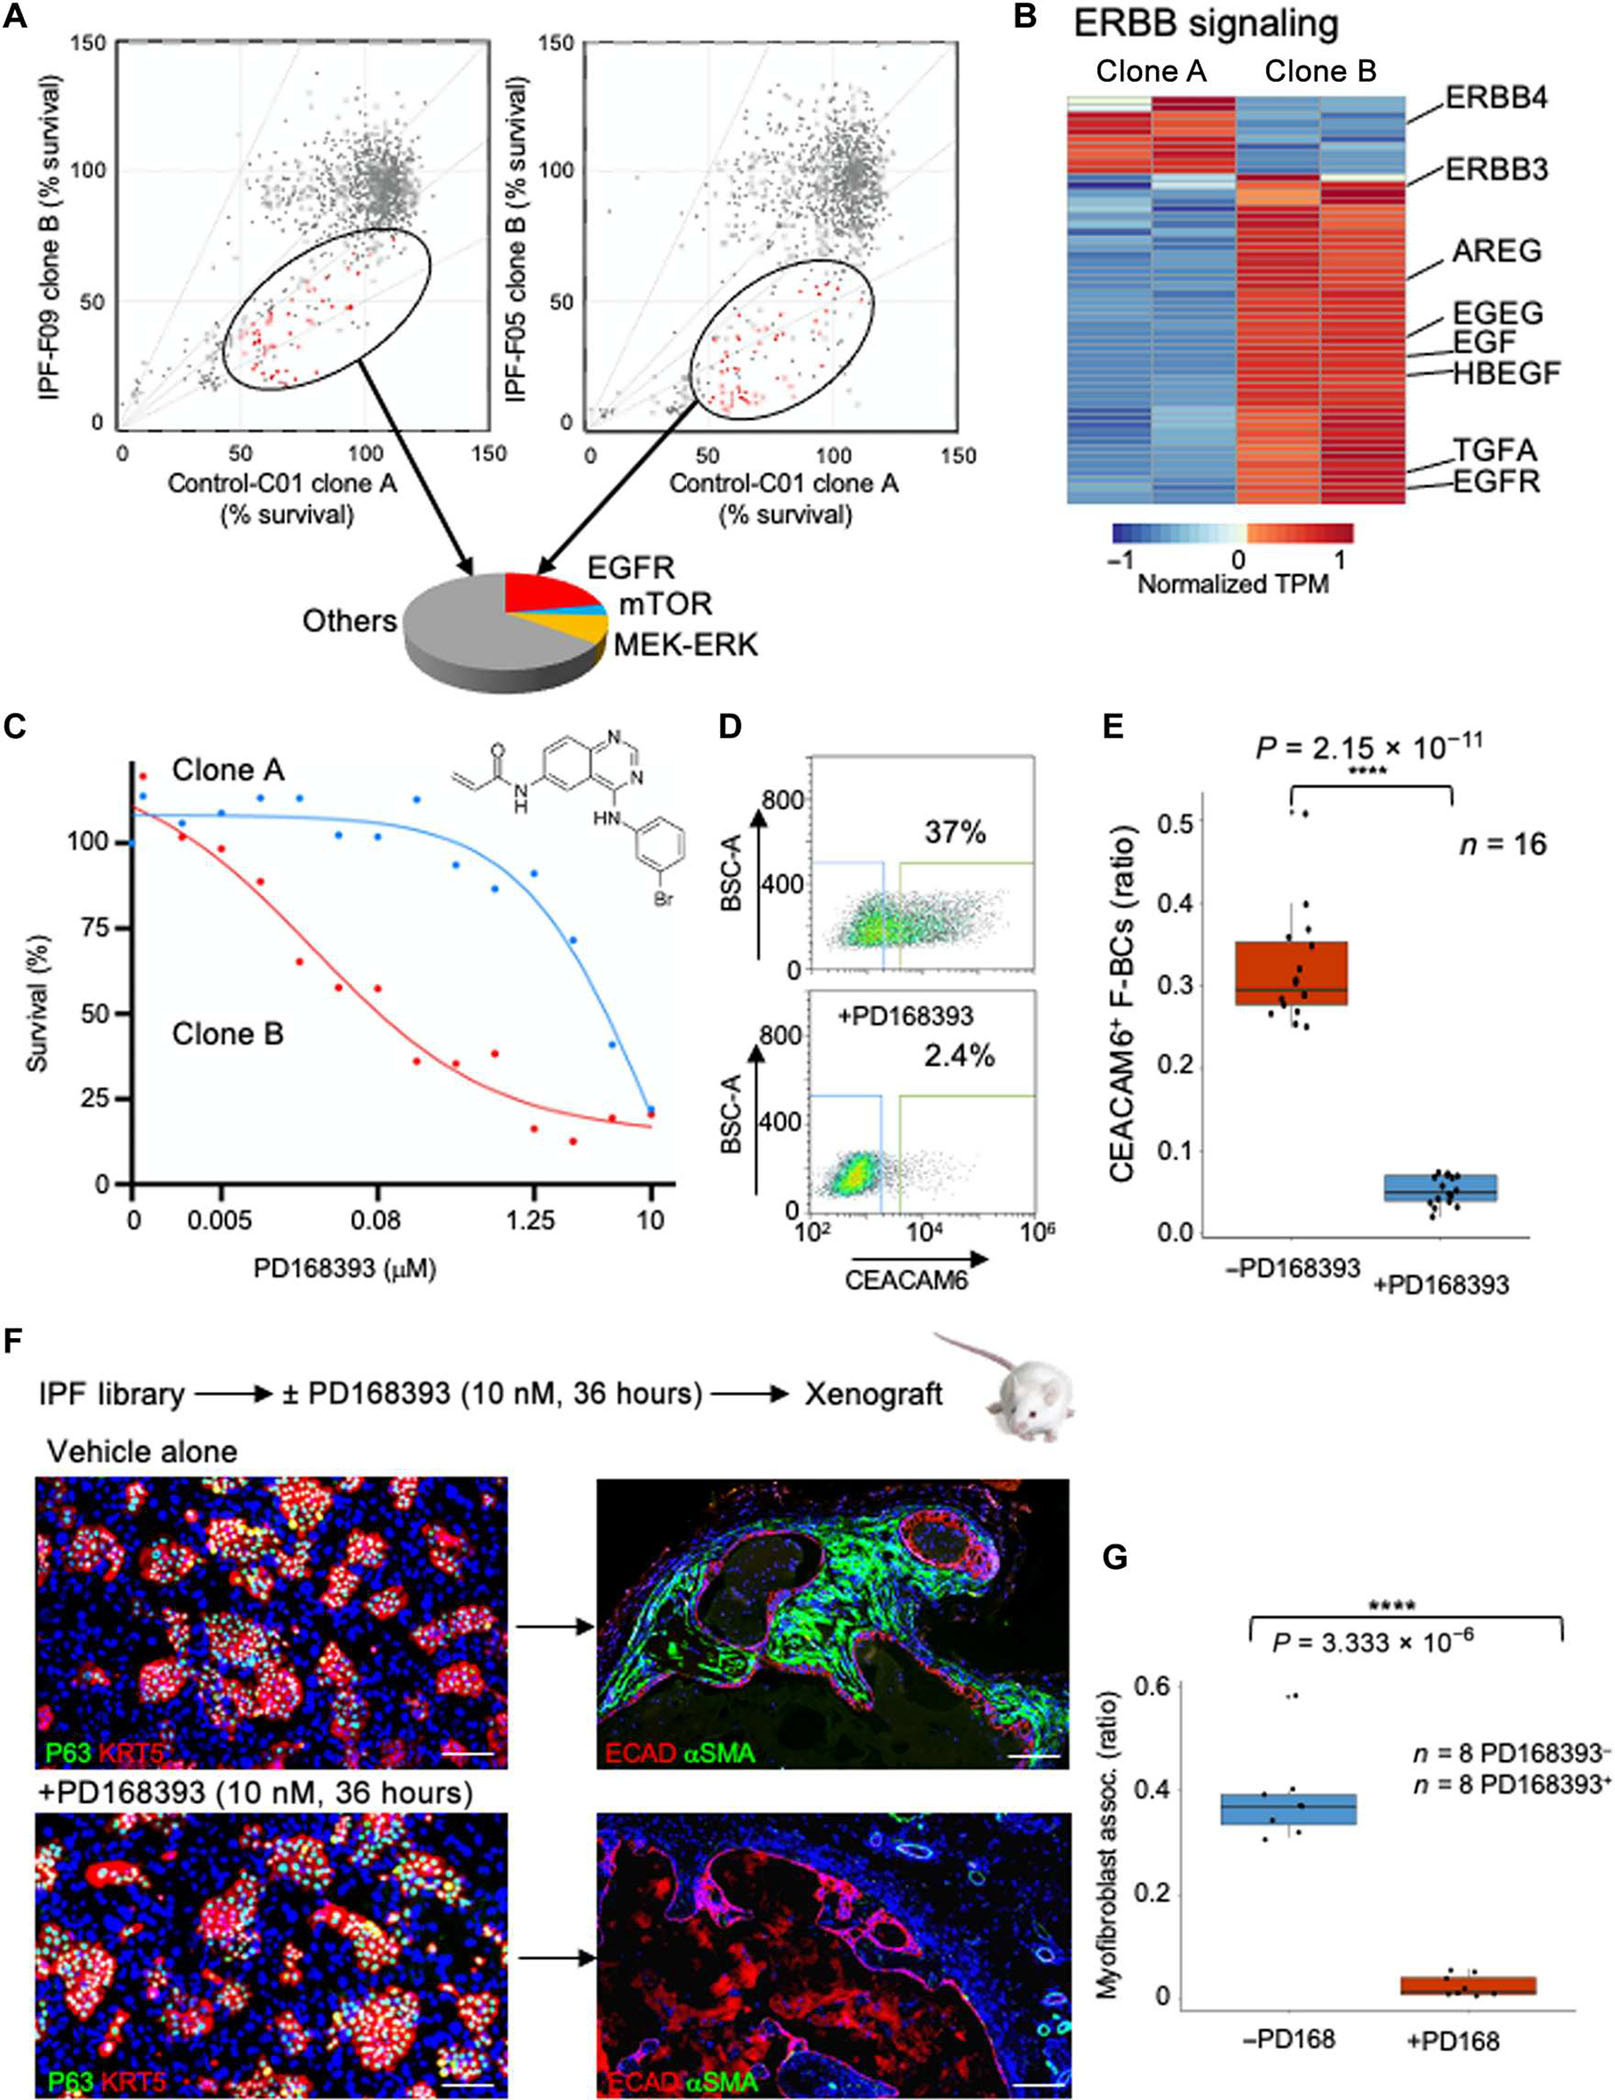
Fig. 6. Vulnerability of cluster B cells to bioactive small molecules.

(A) Two-dimensional survival plots comparing cluster A and cluster B clones from two IPF cases after exposure to a bioactive small-molecule library. Ovals encompass molecules that selectively disfavor cluster B cells in both IPF cases, and the pie chart categorizes the pathways affected by these drugs. mTOR, mammalian target of rapamycin; MEK-ERK, mitogen-activated protein kinase kinase–extracellular signal–regulated kinase. (B) Expression heatmap of genes in the ERBB pathway in IPF clones A and B. (C) Dose response curves of EGFR inhibitor PD168393 for cluster A and cluster B cells. Error bars, SD. (D) CEACAM6 FACS profile of IPF basal cell library before and after exposure to PD168393. (E) Whisker box plot of CEACAM6+ cells in all 16 IPF libraries as a function of exposure to the EGFR inhibitor. (F) Schematic of in vitro exposure of IPF basal cell library to PD168393 followed by xenografting into immunodeficient mice. IF images of libraries (left) and xenograft nodules using the indicated markers. Scale bars, 100 μm. (G) Whisker box plot of morphometric analysis of myofibroblast association in xenografts of eight IPF libraries with or without in vitro exposure to PD168393.
