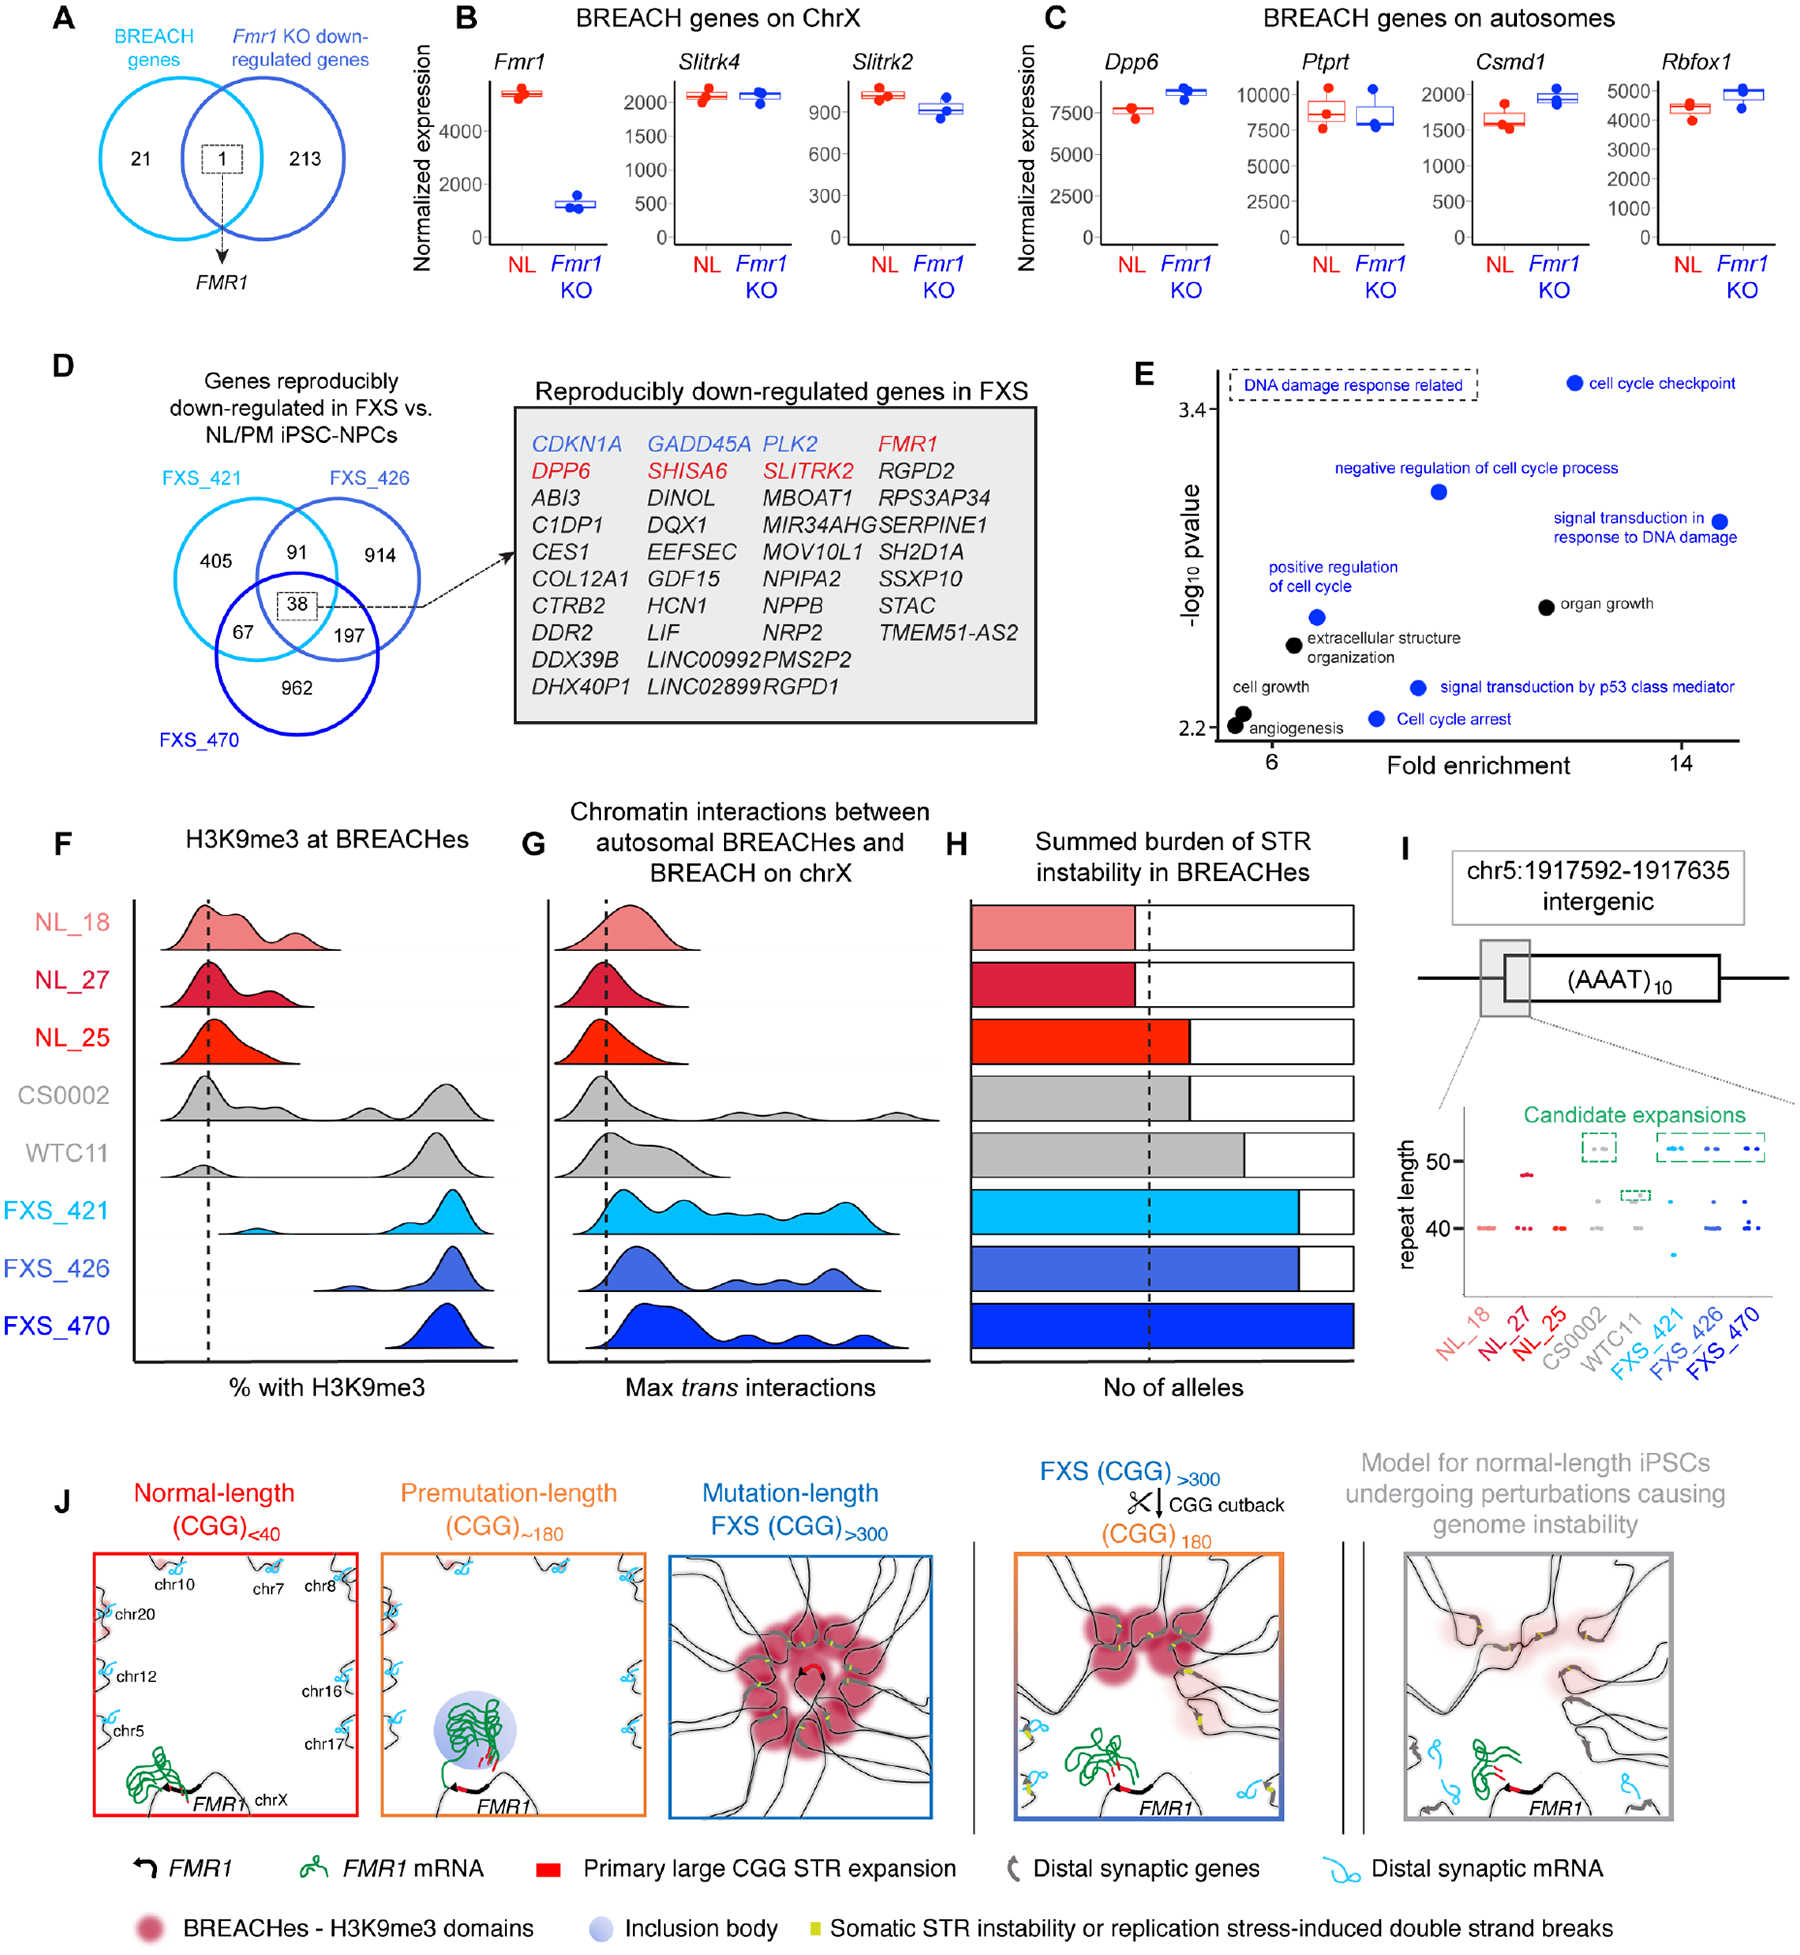
Figure 7. Specific normal-length iPSC lines made with p53 perturbation exhibit an intermediate level of H3K9me3 signal at BREACHes.

(A) Venn diagram showing the overlap between the genes localized with BREACHes from this study and down-regulated genes in Fmr1 knock-out mouse cortical neurons. (B-C) RNA-seq17 comparing expression of BREACH-localized genes in normal-length versus Fmr1 knock-out neurons. (D) Venn diagram showing reproducibly down-regulated genes (n=38) in mutation-length FXS compared to normal-length and premutation iPSC-NPCs. Red genes localize with BREACHes. Blue genes are linked to the DNA damage response. (E) Gene ontology for reproducibly down-regulated genes (n=34) not present in BREACHes. (F-H) Genomic features at BREACHes in normal-length iPSCs (red) and FXS iPSCs from this study derived without p53 shRNA (blue), as well as two prototypic iPSC lines derived with p53 shRNA (grey). (F) H3K9me3, (G) trans interaction frequency, and (H) summed burden of STR instability. (I) STR length computed directly from reads via the CIGAR string for an AAAT tract on chr5. (J) Schematic model of BREACHEs – Beacons of Repeat Expansion Anchored by Contacting Heterochromatin.
