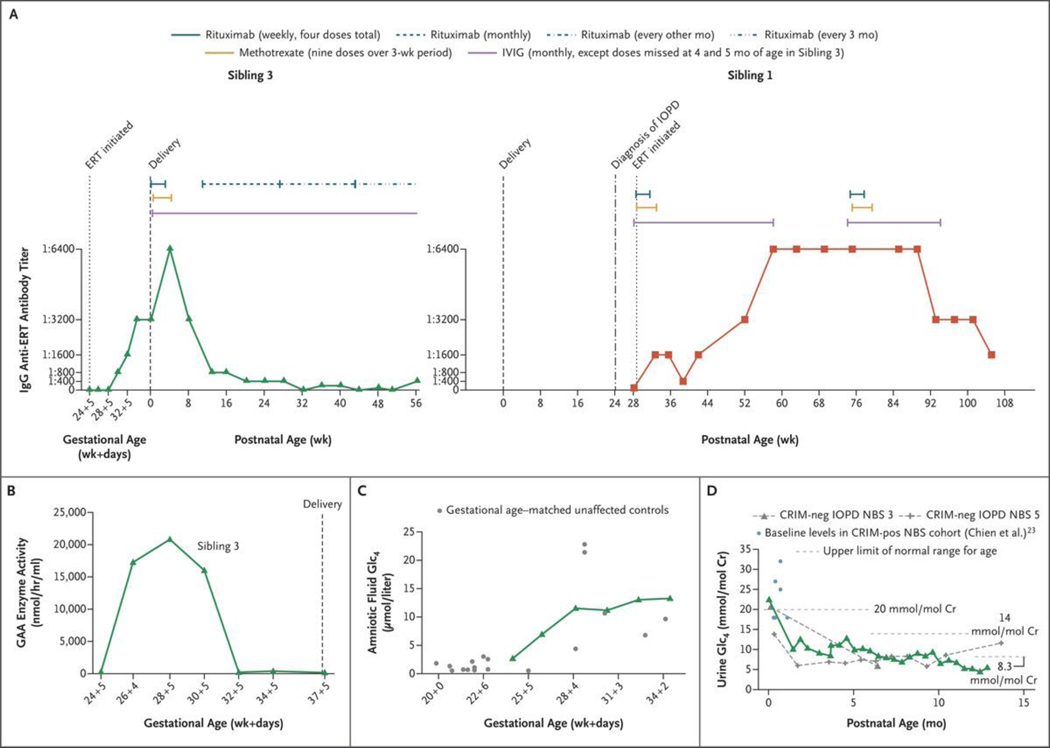
Figure 3. (facing page). Laboratory Monitoring.
Panel A shows the time course for antidrug antibody levels and immune tolerance induction in the current patient (Sibling 3, green; left graph) and the proband (Sibling 1, red; right graph). The antidrug antibody levels of Siblings 1 and 3 reached the same peak, with Sibling 1 having a longer duration of titers at this level. Sibling 3 received immune tolerance induction as previously published,13 followed by monthly rituximab alone, then rituximab alone every other month, and later every 3 months; Sibling 1 received immune tolerance induction as previously published,13 followed by a repetition of a full course of immune tolerance induction (three medications), owing to her persistent titers at 1:6400. Pharmacokinetic and clinical concerns are present when titers reach a level of 1:12,800 or greater.12,15 IVIG denotes intravenous immune globulin. Panel B shows plasma trough levels of acid α-glucosidase (GAA) enzyme activity (obtained before each ERT infusion) in Sibling 3’s fetal plasma over the course of IUERT. Panel C shows glucose tetrasaccharide (Glc4) levels in amniotic fluid samples for Sibling 3 (green) over the course of IUERT infusions as compared with the levels for gestational age–matched unaffected controls (gray). These findings show concordance with unaffected controls and a rise in the levels of this biomarker with older gestational age. Panel D shows the Glc4 levels in neonatal urine samples obtained postnatally from Sibling 3 (green), as compared with baseline values in a previously studied CRIM-positive cohort in the neonatal period at less than 1 month of age (light blue)23 and with values in patients with CRIM-negative IOPD (gray dashed curves) treated after NBS (treated at ≤4 weeks of age).7 Cr denotes creatinine, and pos positive.

