. 2024 Jan 17;13:e83725. doi: 10.7554/eLife.83725

Figure 2. Caspase-11 catalytic activity and autoprocessing at the interdomain linker are required for spontaneous caspase-11 oligomerization in HEK293T cells.

(A) Wild-type (WT), catalytically inactive (C254A), and non-cleavable (D285A) Casp11-mCherry expression plasmids were transfected (0.25 μg) into HEK293T cells. Cell lysates were immunoblotted for mCherry, Casp11, and β-actin (loading control) 10 hr post-transfection. (B) HEK293T cells were transfected with wild-type (WT), catalytically inactive (C254A), or non-cleavable (D285A) Casp11-mCherry as described in ‘Materials and methods’ and imaged by fluorescence microscopy 18 hr post-transfection. Nuclei (blue) were stained with Hoechst, white arrows denote Casp11-mCherry specks. Scale bar = 10 μm. (C) Speck formation in (B) was quantified as percentage of Casp11-mCherry-expressing cells containing at least one speck. (D) HEK293T cells were transfected with Casp11-mCherry constructs as in (B) and 6 hr post-transfection, and cells were incubated with increasing amounts of pan-caspase inhibitor zVAD (0–200 μM; twofold increments). Whole-cell lysates were isolated 12 hr post-transfection and immunoblotted for mCherry or β-actin loading control as indicated. Cleaved p10-mCherry is denoted. (E) Casp11-mCherry speck formation was assayed in zVAD-treated cells by fluorescence microscopy as in (B). (F) Speck formation in (E) was quantified as percentage of Casp11-mCherry-expressing cells containing at least one speck. Dose–response curves in (F) were plotted by least-squares nonlinear regression ([Log2(inhibitor) vs. response (three parameters)]; Y = Bottom + (Top-Bottom)/(1 + 10(X-LogIC50)); R2 indicated). Error bars represent mean ± SEM of triplicate wells (800–900 cells per well); representative of 2–3 independent experiments. Bar graphs in (C) were analyzed by two-way ANOVA with Sidak’s multiple-comparison test, ***p<0.001.

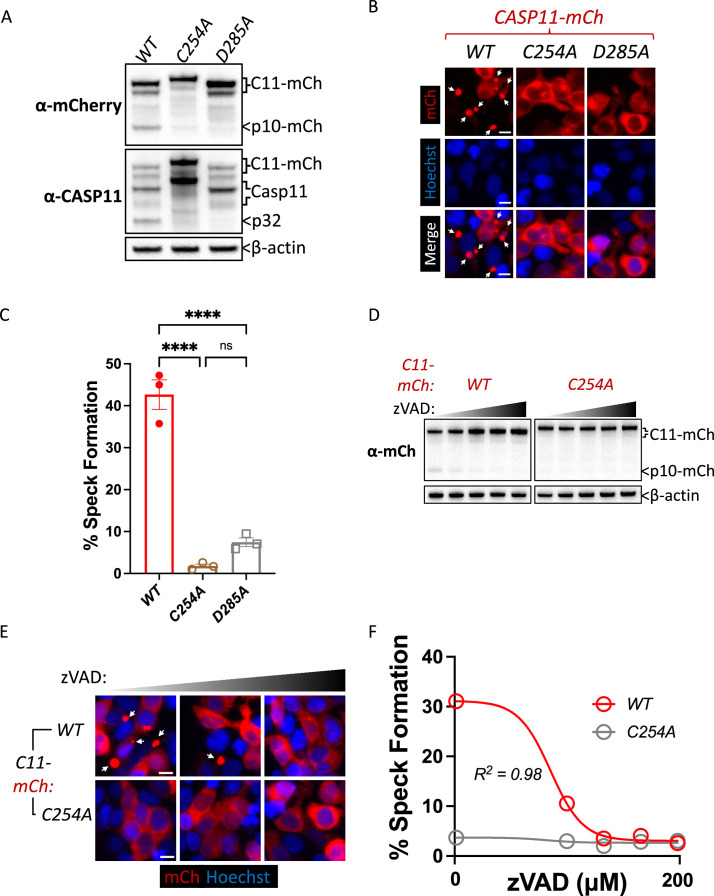
Figure 2—source data 1. Source data for Figure 2A.
Indicated Casp11-mCherry expression plasmids were transfected into HEK293T cells. Cell lysates were immunoblotted for mCherry, Casp11, and β-actin (loading control) 10 hr post-transfection.
Figure 2—source data 2. Source data for Figure 2B.
HEK293T cells were transfected with wild-type (WT), catalytically inactive (C254A), or non-cleavable (D285A) Casp11-mCherry and imaged by fluorescence microscopy 18 hr post-transfection. Nuclei (blue) were stained with Hoechst.
Figure 2—source data 3. Source data for Figure 2D.
HEK293T cells were transfected with Casp11-mCherry constructs and 6 hr post-transfection, cells were incubated with increasing amounts of pan-caspase inhibitor zVAD (0–200 μM; twofold increments). Whole-cell lysates were isolated 12 hr post-transfection and immunoblotted for mCherry or β-actin as loading control as indicated. Cleaved p10-mCherry is denoted.
Figure 2—source data 4. Source data for Figure 2E.
Casp11-mCherry speck formation was assayed in zVAD-treated cells by fluorescence microscopy. Nuclei are stained with Hoechst.
Figure 2—source data 5. Source data for Figure 2F.
Speck formation in Figure 2E was quantified as percentage of Casp11-mCherry-expressing cells containing at least one speck. Dose–response curves were plotted by least-squares nonlinear regression ([Log2(inhibitor) vs. response (three parameters)]; Y = Bottom + (Top-Bottom)/(1 + 10(X-LogIC50)); R2 indicated).

Figure 2.

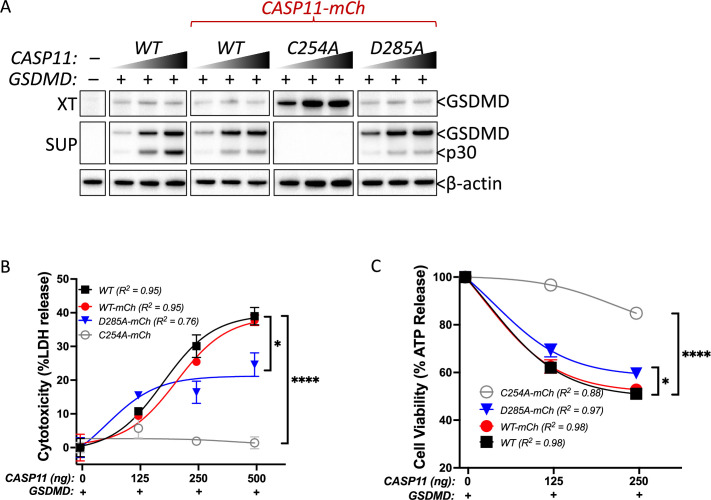
Figure 2—figure supplement 1. Casp11-mCherry maintains enzymatic function in HEK293T cells.

Figure 2—figure supplement 1.

Gasdermin D (GSDMD) expression plasmid was co-transfected with increasing doses of indicated Casp11 constructs in HEK293T cells. WT untagged Casp11 was included as positive control. After 12 hr (A) or 16 hr (B, C), Casp11 activity was determined by (A) immunoblotting for GSDMD processing in supernatants (sup) and whole-cell lysates (XT), (B) cytotoxicity, and (C) cell viability as indicated in ‘Materials and methods.’ Error bars indicate mean ± SEM of triplicate wells; representative of 2–3 independent experiments. Dose–response curves in (B) were plotted by least-squares nonlinear regression ([Log2(agonist) vs. response (three parameters)]; Y = Bottom + (Top-Bottom)/(1 + 10(LogEC50-X)); R2 indicated). Dose–response curves in (C) were plotted by least-squares nonlinear regression ([Log2(inhibitor) vs. response (three parameters)]; Y = Bottom + (Top-Bottom)/(1 + 10(X-LogIC50)); R2 indicated). Two-way ANOVA with Sidak’s multiple-comparison test (highest doses), *p<0.05, ****p<0.0001.
Figure 2—figure supplement 1—source data 1. Source data for Figure 2—figure supplement 1A.
Gasdermin D (GSDMD) expression plasmid was co-transfected with increasing doses of indicated Casp11 construct in HEK293T cells. WT untagged Casp11 was included as positive control.
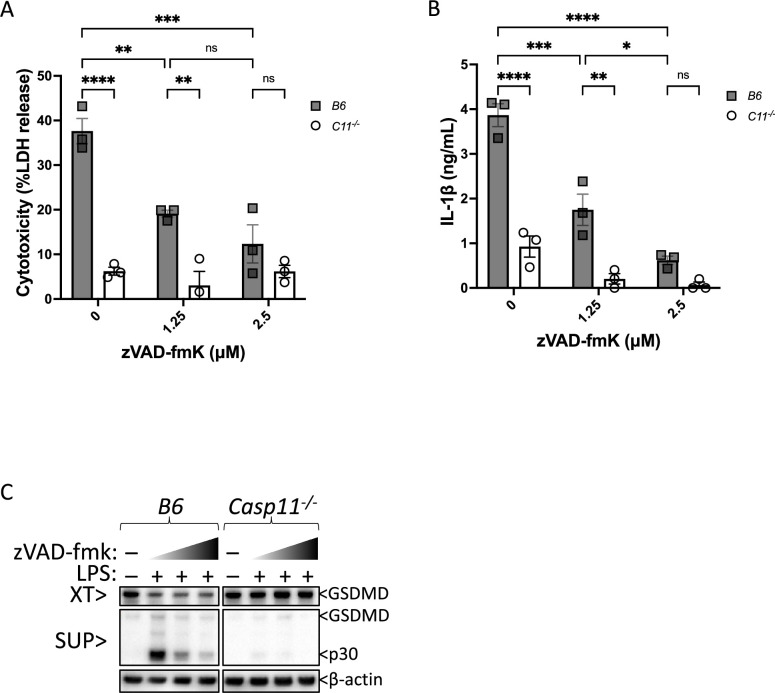
Figure 2—figure supplement 2. Casp11 catalytic activity mediates gasdermin D (GSDMD) cleavage, pyroptosis, and IL-1β release in response to intracellular lipopolysaccharide (LPS) in primary bone marrow-derived macrophages (BMDMs).

Figure 2—figure supplement 2.

Wild-type (B6) or Casp11-/- primary BMDMs were primed with Pam3CSK4 for 4 hr, followed by transfection with the indicated concentrations of LPS from S. enterica serotype Minnesota. To inhibit Casp11 activity, cells were incubated with indicated concentrations of zVAD beginning 30 min before (and lasting through) LPS transfection. After 16 hr, pyroptosis was measured by (A) assessing supernatants for lactate dehydrogenase (LDH) release (normalized to maximum cell lysis by TritonX-100), (B) analyzing IL-1β release in supernatants by ELISA, and (C) immunoblotting for GSDMD cleavage in supernatants (sup) and whole-cell lysates (XT). β-actin is indicated as loading control. Error bars = mean ± SEM of triplicate wells; representative of 2–3 independent experiments. *p<0.05, **p<0.01, ***p<0.001, ****p<0.0001, ns, not significant. Two-way ANOVA with Sidak’s multiple-comparison test.
Figure 2—figure supplement 2—source data 1. Source data for Figure 2—figure supplement 2C.
Immunoblot for gasdermin D (GSDMD) cleavage in supernatants (sup) and whole-cell lysates (XT). β-actin is indicated as loading control.
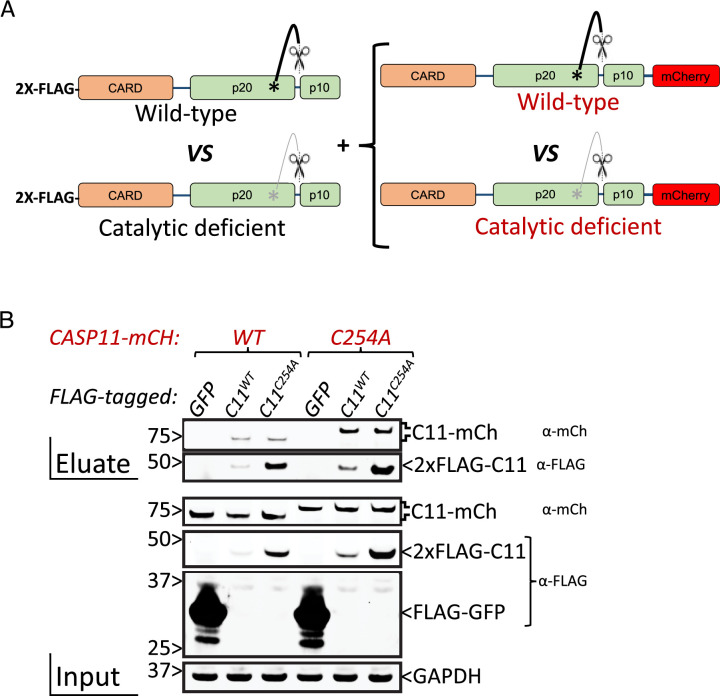
Figure 2—figure supplement 3. Catalytic activity is not required for caspase-11 intermolecular interactions.

Figure 2—figure supplement 3.

(A) Tagged caspase-11 expression used for FLAG-based co-immunoprecipitation. (B) HEK293T cells were transiently transfected with 2X-FLAG-tagged wild-type (WT) or catalytically inactive (C254A) Casp11 expression plasmids alongside WT or C254A mCherry-tagged Casp11 (5 μg). 48 hr post-transfection, whole-cell lysates were immunoprecipitated by anti-FLAG antibodies as described in ‘Materials and methods,’ and immunoblotted for mCherry, FLAG, or GAPDH as a loading control, as indicated.
Figure 2—figure supplement 3—source data 1. Source data for Figure 2—figure supplement 3B.
HEK293T cells were transiently transfected with 2X-FLAG-tagged wild-type (WT) or catalytically inactive Casp11 expression plasmids alongside WT or C254A mCherry-tagged Casp11 (5 μg). 48 hr post-transfection, whole-cell lysates were immunoprecipitated by anti-FLAG antibodies as described in ‘Materials and methods,’ and immunoblotted for mCherry, FLAG, or GAPDH as a loading control, as indicated.