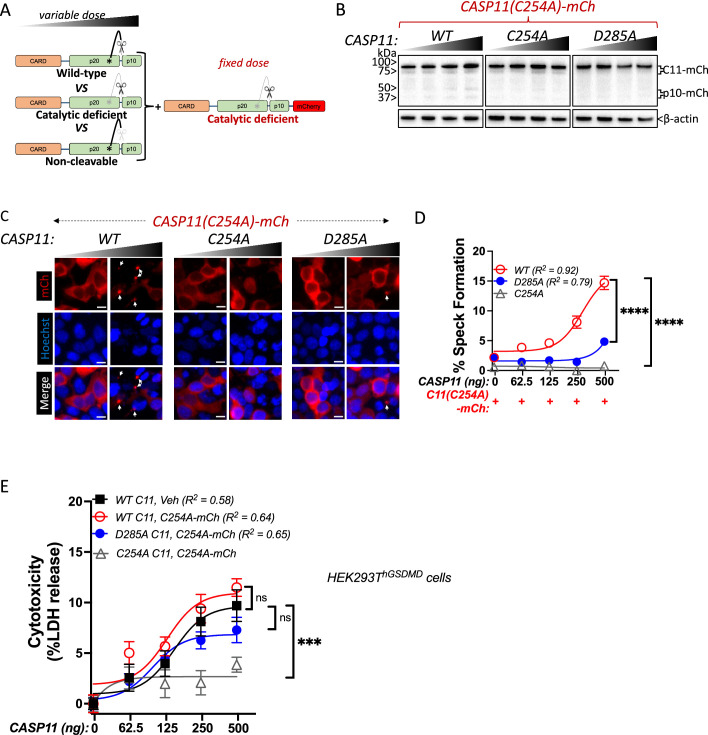
(A) Schematic diagram indicating co-transfection combinations used in (B–D). Unlabeled wild-type (WT), catalytically inactive (C254A), or non-cleavable (D285A) caspase-11 constructs were transfected into HEK293T cells at increasing doses, together with a fixed dose of catalytically inactive (C254A) mCherry-tagged caspase-11. (B) 12 hr post-transfection, whole-cell lysates were harvested and immunoblotted for mCherry or β-actin as loading control. (C) 18 hr following transfection, cells were imaged by fluorescence microscopy. Nuclei (blue) are stained with Hoechst, white arrows denote caspase-11 specks, scale bar = 10 μm. (D) Speck formation was quantified as percentage of mCherry-expressing cells containing at least one speck. (E) HEK293T cells stably expressing human gasdermin D (hGSDMD) were transiently transfected with a fixed dose of empty plasmid (Veh) OR mCherry-tagged C254A caspase-11, plus increasing doses of unlabeled WT, C254A, or D285A caspase-11 constructs. Cytotoxicity was measured as percent lactate dehydrogenase (LDH) release 18 hr post-plasmid transfection. All error bars = mean ± SEM of triplicate wells (800–900 cells per well); representative of three independent experiments. Dose–response curves were plotted by least-squares nonlinear regression ([Log2(agonist) vs. response (three parameters)]; Y = Bottom + (Top-Bottom)/(1 + 10(LogEC50-X)); R2 indicated). Two-way ANOVA (highest doses) with Sidak’s multiple-comparison test, ns, not significant, ***p<0.001, ****p<0.0001.
Figure 5—source data 1. Source data for Figure 5B.Unlabeled wild-type (WT), catalytically inactive (C254A), or non-cleavable (D285A) caspase-11 constructs were transfected into HEK293T cells at increasing doses, together with a fixed dose of catalytically inactive (C254A) mCherry-tagged caspase-11. 12 hr post-transfection, whole-cell lysates were harvested and immunoblotted for mCherry or β-actin as loading control.
Figure 5—source data 2. Source data for Figure 5C.Unlabeled wild-type (WT), catalytically inactive (C254A), or non-cleavable (D285A) caspase-11 constructs were transfected into HEK293T cells at increasing doses, together with a fixed dose of catalytically inactive (C254A) mCherry-tagged caspase-11. 18 hr following transfection, cells were imaged by fluorescence microscopy. Nuclei (blue) are stained with Hoechst.
Figure 5—source data 3. Source data for Figure 5D.Speck formation in (C) was quantified as percentage of mCherry-expressing cells containing at least one speck. Dose–response curves were plotted by least-squares nonlinear regression ([Log2(agonist) vs. response (three parameters)]; Y = Bottom + (Top-Bottom)/(1 + 10(LogEC50-X))).
Figure 5—source data 4. Source data for Figure 5E.HEK293T cells stably expressing human gasdermin D were transiently transfected with a fixed dose of empty plasmid (Veh) OR mCherry-tagged C254A caspase-11, plus increasing doses of unlabeled wild-type (WT), catalytically inactive (C254A), or non-cleavable (D285A) caspase-11 constructs. Cytotoxicity was measured as percent lactate dehydrogenase (LDH) release 18 hr post-plasmid transfection (with respect to 1% Triton X-100-induced cytotoxicity). Dose–response curves were plotted by least-squares nonlinear regression ([Log2(agonist) vs. response (three parameters)]; Y = Bottom + (Top-Bottom)/(1 + 10(LogEC50-X)); R2 indicated).

