
Table 6.
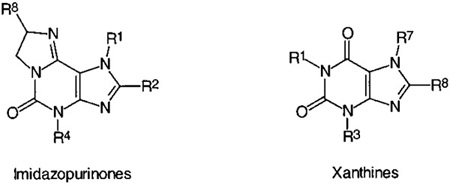
Functional Antagonist Activity of Selected Imidazopurinones at A1, A2A, and A2B ARs in Comparison with Standard Xanthine Derivatives
|
|||||||
|---|---|---|---|---|---|---|---|
| compd | R1 | R2 | R4 | R8 | KB ± SEM (μM) | ||
| A1 | A2A | A2B | |||||
| Imidazopurinones | |||||||
| 21 | methyl | phenyl | H | H | 0.50 ± 0.11 | 17 ± 2 | 7.0 ± 0.3 |
| R-24 | H | phenyl | methyl | (R)-ethyl | 0.43 ± 0.10 | 2.5 ± 0.2 | 2.1 ± 0.3 |
| S-24 | H | phenyl | methyl | (S)-ethyl | 0.063 ± 0.021 | 4.3 ± 0.1 | 7.6 ± 7.3 |
| S-25 | methyl | styryl | methyl | (S)-ethyl | 33 ± 10 | 1.0 ± 0.1 | 3.7 ± 0.3 |
| Xanthines | |||||||
| R7 | R8 | R3 | R1 | ||||
| 11f | methyl | phenyl | H | methyl | 0.32 ± 0.03 | 5.7 ± 0.7 | 5.2 ± 0.9 |
| caffeine | methyl | H | methyl | methyl | 60a | 36 ± 4a | 25 ± 2 |
| theophylline | H | H | methyl | methyl | 8.7a | 13.7 ± 0.4a | 16 ± 8 |
| enprofylline | H | H | propyl | H | 32 ± 2b | 120 ± 17a | 18 ± 4 |
a
Data from Choi; et al. Life Sci. 1988, 43, 387–398; Hide; et al. Mol. Pharmacol. 1992, 41, 352–359; Ukena; et al. Life Sci. 1986, 39, 743–750; and Brackett; Daly. Biochem. Pharmacol. 1994, 47, 801–804.
b
Binding data: Rat cerebral cortical membranes, [3H]R-PIA. Müller; et al. J. Med. Chem. 1993, 36, 3341–3349; also, 81 μM. Shamim; et al. J. Med. Chem. 1989, 32, 1231.