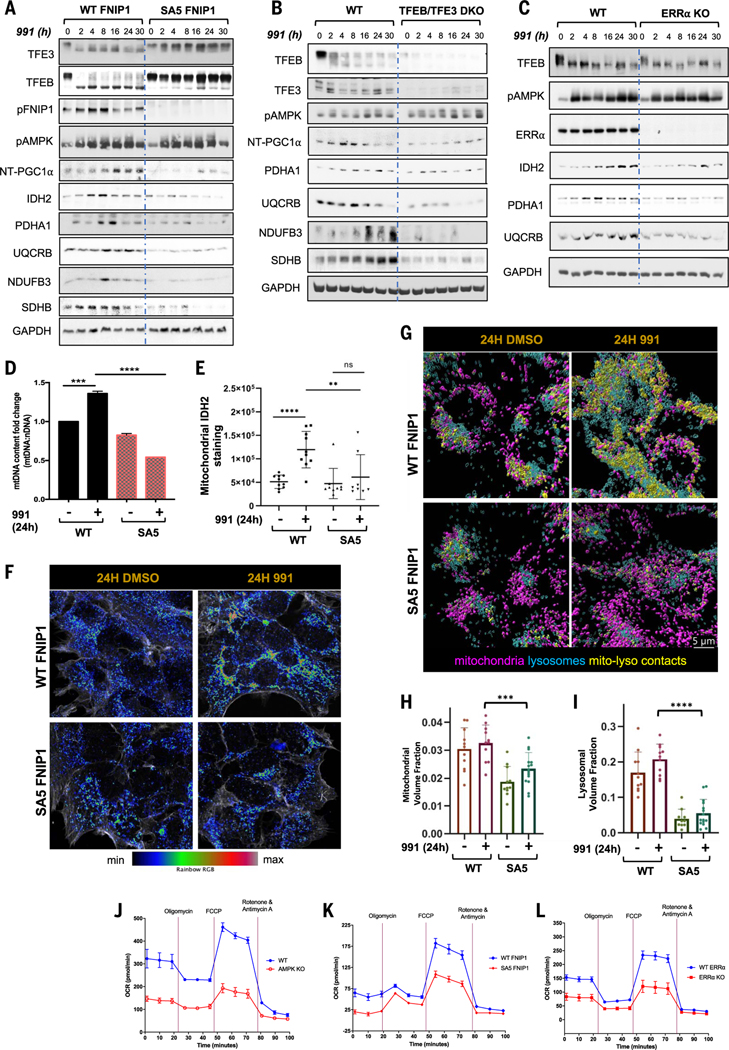
Fig. 6. AMPK-FNIP1–mediated mitochondrial biogenesis affects mitochondrial function and behavior.
(A to C) Western blots probing mitochondrial protein expression after a 991 time course ranging from 0 to 30 hours in WT FNIP1 and SA5 FNIP1 HEK293T cells (A), WT and TFEB-TFE3 DKO HEK293T cells (B), and WT and ERRα KO HEK293T cells (C). (D) Mitochondrial DNA content analysis. The ratio of mitochondrial (16S) to nuclear (actin) DNA was determined by qRT-PCR after treatment for 24 hours with 991 or DMSO (vehicle), as indicated. (E) Quantitation of IDH2 staining in (F). (F) Representative Airyscan microscopy images of mitochondrial IDH2 staining in WT FNIP1 and SA5 FNIP1 HEK293T cells treated for 24 hours with 991 or DMSO, as indicated. (G) Representative Airyscan images of Lamp2-stained lysosomes and Cox IV–stained mitochondria in WT FNIP1 and SA5 FNIP1 HEK293T cells treated for 24 hours with DMSO or 991, as indicated. (H) Quantitation of mitochondrial volume in (G). (I) Quantitation of lysosomal volume in (G). (J) Seahorse assay to measure OCR in WT compared with AMPK KO HEK293T cells. (K) Seahorse assays displaying OCR in WT FNIP1 compared with SA5 FNIP1 HEK293T cells. (L) Seahorse assays measuring OCR in WT compared with ERRα KO HEK293T cells. Graphs are shown as the means ± SEMs. n = 3. *P < 0.05; **P < 0.01; ***P < 0.001; ****P < 0.0001; unpaired t test.

