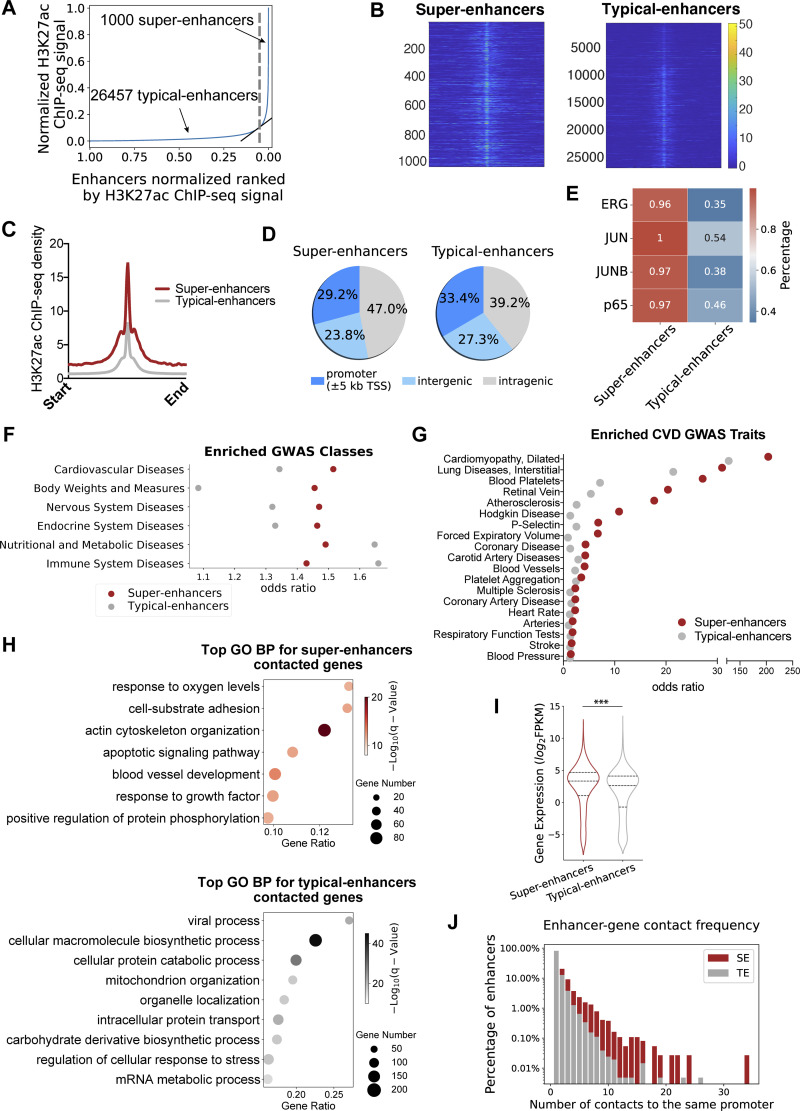
Figure 1.
Endothelial super-enhancers are enriched with transcription factor binding sites and genetic variants associated with cardiovascular diseases and preferentially contact with the promoters of EC-enriched genes. (A) Typical- and super-enhancers in human aortic endothelial cells (HAECs) are ranked along the x-axis on the basis of H3K27ac enrichment plotted on the y-axis. Super-enhancers (right of the gray dashed line) are defined as regions to the right of the tangency point (slope = 1) of the resulting curve (highlighted in gray). (B) Heatmaps of normalized H3K27ac tag counts of the 1,000 super-enhancers (left) and 26,457 typical-enhancers (right) in HAECs. (C) Histogram of the averaged normalized H3K27ac tag counts of the 1,000 super-enhancers (red) and 26,457 typical-enhancers (gray) in HAECs. (D) Pie charts of genomic distributions of the 1,000 super-enhancers (left) and 26,457 typical-enhancers (right) in HAECs. (E) Heatmap demonstrating the percentage of super-enhancers or typical-enhancers containing binding sites for transcription factor ERG, JUN, JUNB, or p65. (F) Top GWAS disease classes associated with endothelial SE- or TE-harboring SNPs. X-axis represents the odds ratio of these disease-associated SNPs residing inside versus outside of super-enhancers (red), and inside versus outside of typical-enhancers (gray). (G) Top cardiovascular disease (CVD) GWAS traits associated with endothelial SE- or TE-harboring SNPs. X-axis represents the odds ratio of these disease-associated SNPs residing inside versus outside of super-enhancers (red), and inside versus outside of typical-enhancers (gray). (H) Gene ontology analyses revealed top biological processes of genes contacted by EC super-enhancers (top) or typical-enhancers (bottom). (I) The transcriptional level (FPKM) of genes contacted by super-enhancers (red) or typical-enhancers (gray) in HAECs. Quartiles were represented by dashed lines. (J) Gene contact frequency of super-enhancers (red) and typical-enhancers (gray), demonstrated by the percentage of these enhancers that contact with a given promoter. ***P value ≤0.001 was determined by a two-sided Student’s t test.

