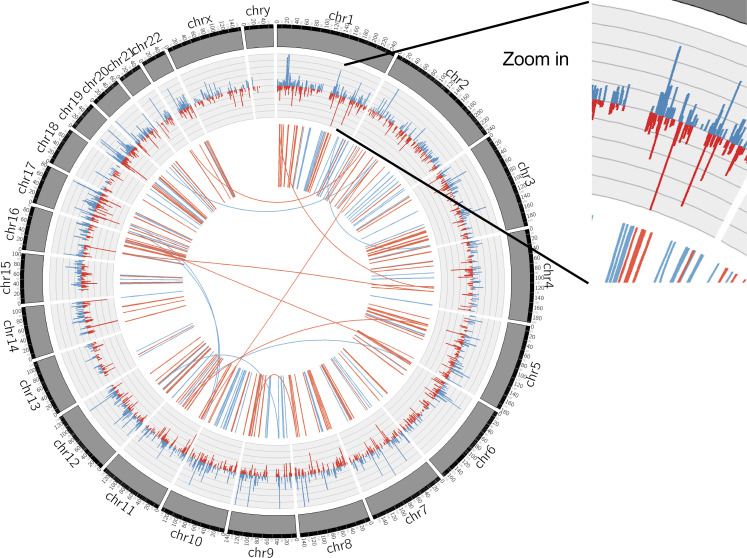
Figure S2.
Circos plot illustrating the genome-wide loci contacted by flow-sensitive super-enhancers and the flow-sensitive transcriptome in HAECs. Inner circle links: PCHi-C-detected intra- and inter-chromosomal interactions. Physical connections between UF-enriched super-enhancers and gene promoters are labeled in blue, and physical connections between DF-enriched super-enhancers and promoters are labeled in red. Outer circle histograms: RNA-seq-detected expression levels (FPKMs) of flow-sensitive genes (q value ≤0.05) in HAECs subjected to either 24-h UF or DF. Blue histograms represent the mRNA levels of flow-sensitive genes in HAECs cultured under UF and red histograms show their mRNA levels in HAECs cultured under DF. Overall, flow-regulated genes are largely located in genomic loci contacted by flow-sensitive super-enhancers.

