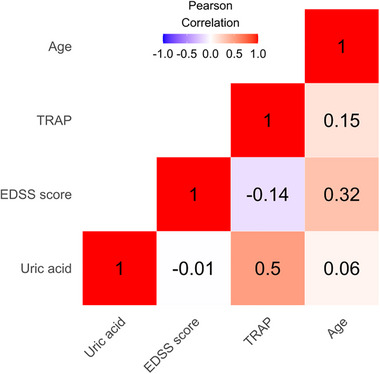
FIGURE 1.

Correlation heatmap for the continuous variables: uric acid (UA), expanded disability status scale (EDSS) score, total radical trapping parameter (TRAP), and age. The intensity of color indicates the strength and direction of correlation: Red colors represent positive correlations; blues represent negative correlation.
