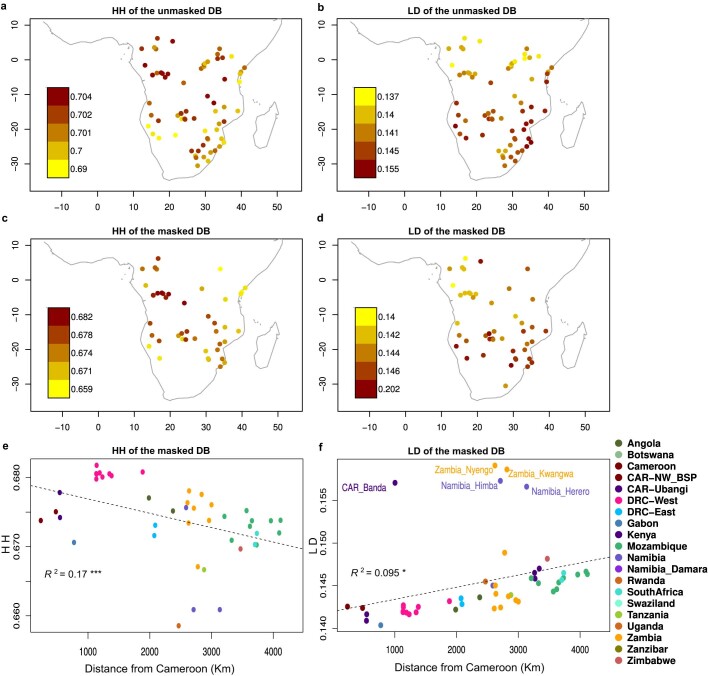
Extended Data Fig. 6. Haplotype heterozygosity (HH) and linkage disequilibrium (LD) distribution in BSP.
HH (left column) and LD (right column) estimates were calculated for the unmasked and masked Only-BSP dataset (DB) including only populations with a minimum sample size of 10 individuals and a maximum sample size of 30. HH was estimated on a window size of 50 kb and LD was estimated as r2 at 50 kb (Supplementary Information). Figure showing for each population of the unmasked DB: a, HH estimates (based on 67 populations in total); and b, LD estimates (based on 70 populations). Figure showing for each population of the masked DB: c, HH estimates; d, LD estimates; e, decrease of HH estimates with geographical distance from Cameroon; and f, increase of LD estimates with geographical distance from Cameroon (based on 49 populations; populations with LD > 0.27 were excluded from this analysis). In e and f, spatial distances were calculated as the spherical distance from each population and a centroid position located in the centre of Cameroon. The dotted line represents the linear regression between the estimates of each statistic and the geographical distances.

