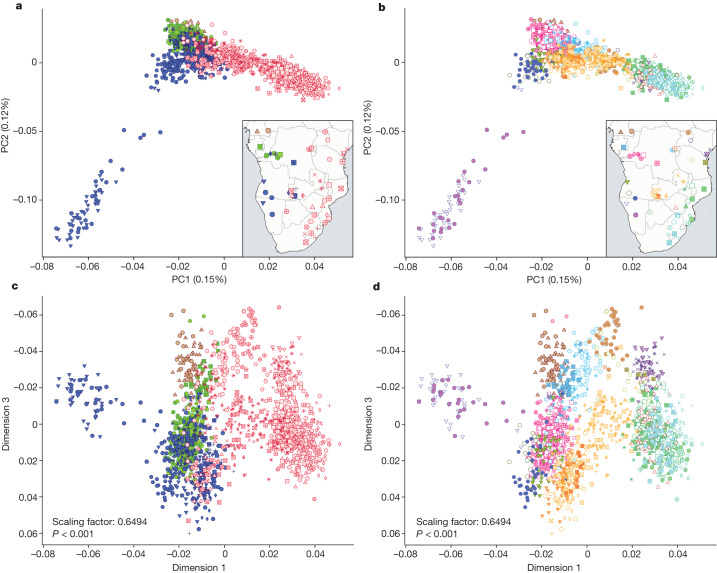
Fig. 3. Population structure patterns in BSP after admixture masking.
a–d, PCA plots on the admixture-masked BSP dataset show BSP coloured by linguistic groups in PC1 versus PC2 (a) and PC1 versus PC3 (c), and by geography represented by countries in PC1 versus PC2 (b) and PC1 versus PC3 (d). Procrustes rotation was used for c and d and the estimated scaling factor was 0.649 (P < 0.001). Further details and legends are included in Supplementary Fig. 34. Vector basemap and map tiles were provided by CartoDB under a Creative Commons licence CC BY 4.0 (2023).

